Immigrants from Albania 4 or more Vehicles in Household
COMPARE
Immigrants from Albania
Select to Compare
4 or more Vehicles in Household
Immigrants from Albania 4 or more Vehicles in Household
4.1%
4+ VEHICLES AVAILABLE
0.0/ 100
METRIC RATING
333rd/ 347
METRIC RANK
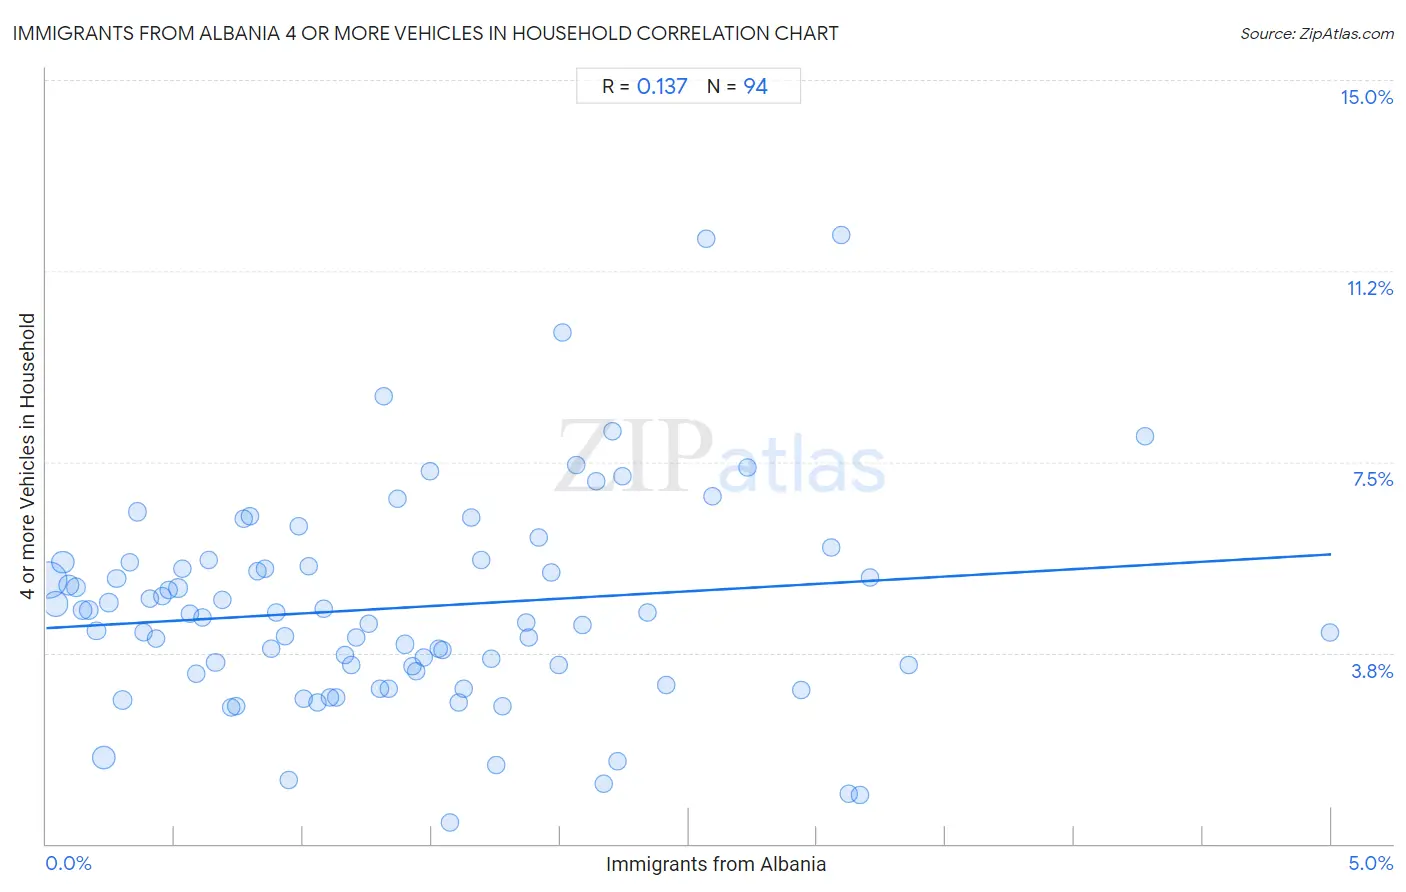
Immigrants from Albania 4 or more Vehicles in Household Correlation Chart
The statistical analysis conducted on geographies consisting of 118,698,484 people shows a poor positive correlation between the proportion of Immigrants from Albania and percentage of households with 4 or more vehicles available in the United States with a correlation coefficient (R) of 0.137 and weighted average of 4.1%. On average, for every 1% (one percent) increase in Immigrants from Albania within a typical geography, there is an increase of 0.29% in percentage of households with 4 or more vehicles available.
It is essential to understand that the correlation between the percentage of Immigrants from Albania and percentage of households with 4 or more vehicles available does not imply a direct cause-and-effect relationship. It remains uncertain whether the presence of Immigrants from Albania influences an upward or downward trend in the level of percentage of households with 4 or more vehicles available within an area, or if Immigrants from Albania simply ended up residing in those areas with higher or lower levels of percentage of households with 4 or more vehicles available due to other factors.
Demographics Similar to Immigrants from Albania by 4 or more Vehicles in Household
In terms of 4 or more vehicles in household, the demographic groups most similar to Immigrants from Albania are Immigrants from Trinidad and Tobago (4.1%, a difference of 0.21%), Immigrants from Dominica (4.2%, a difference of 1.7%), West Indian (4.2%, a difference of 2.6%), Immigrants from Ecuador (4.2%, a difference of 2.9%), and Immigrants from Senegal (4.2%, a difference of 3.1%).
| Demographics | Rating | Rank | 4 or more Vehicles in Household |
| Cape Verdeans | 0.0 /100 | #326 | Tragic 4.4% |
| Senegalese | 0.0 /100 | #327 | Tragic 4.3% |
| Trinidadians and Tobagonians | 0.0 /100 | #328 | Tragic 4.3% |
| Immigrants from Senegal | 0.0 /100 | #329 | Tragic 4.2% |
| Immigrants from Ecuador | 0.0 /100 | #330 | Tragic 4.2% |
| West Indians | 0.0 /100 | #331 | Tragic 4.2% |
| Immigrants from Dominica | 0.0 /100 | #332 | Tragic 4.2% |
| Immigrants from Albania | 0.0 /100 | #333 | Tragic 4.1% |
| Immigrants from Trinidad and Tobago | 0.0 /100 | #334 | Tragic 4.1% |
| Barbadians | 0.0 /100 | #335 | Tragic 3.9% |
| Immigrants from Bangladesh | 0.0 /100 | #336 | Tragic 3.9% |
| Vietnamese | 0.0 /100 | #337 | Tragic 3.9% |
| Immigrants from Cabo Verde | 0.0 /100 | #338 | Tragic 3.8% |
| Immigrants from Uzbekistan | 0.0 /100 | #339 | Tragic 3.6% |
| Immigrants from Barbados | 0.0 /100 | #340 | Tragic 3.6% |
Immigrants from Albania 4 or more Vehicles in Household Correlation Summary
| Measurement | Immigrants from Albania Data | 4 or more Vehicles in Household Data |
| Minimum | 0.011% | 0.42% |
| Maximum | 5.0% | 12.0% |
| Range | 5.0% | 11.5% |
| Mean | 1.4% | 4.6% |
| Median | 1.2% | 4.5% |
| Interquartile 25% (IQ1) | 0.61% | 3.4% |
| Interquartile 75% (IQ3) | 2.0% | 5.5% |
| Interquartile Range (IQR) | 1.4% | 2.1% |
| Standard Deviation (Sample) | 0.99% | 2.1% |
| Standard Deviation (Population) | 0.98% | 2.1% |
Correlation Details
| Immigrants from Albania Percentile | Sample Size | 4 or more Vehicles in Household |
[ 0.0% - 0.5% ] 0.011% | 44,303,738 | 5.2% |
[ 0.0% - 0.5% ] 0.038% | 16,896,968 | 4.7% |
[ 0.0% - 0.5% ] 0.065% | 10,234,005 | 5.5% |
[ 0.0% - 0.5% ] 0.089% | 5,572,203 | 5.1% |
[ 0.0% - 0.5% ] 0.12% | 3,942,870 | 5.0% |
[ 0.0% - 0.5% ] 0.14% | 2,609,394 | 4.6% |
[ 0.0% - 0.5% ] 0.17% | 2,818,477 | 4.6% |
[ 0.0% - 0.5% ] 0.19% | 1,815,483 | 4.2% |
[ 0.0% - 0.5% ] 0.23% | 11,531,470 | 1.7% |
[ 0.0% - 0.5% ] 0.25% | 2,418,256 | 4.7% |
[ 0.0% - 0.5% ] 0.27% | 1,049,658 | 5.2% |
[ 0.0% - 0.5% ] 0.30% | 2,778,020 | 2.8% |
[ 0.0% - 0.5% ] 0.33% | 983,306 | 5.5% |
[ 0.0% - 0.5% ] 0.35% | 339,944 | 6.5% |
[ 0.0% - 0.5% ] 0.38% | 938,194 | 4.2% |
[ 0.0% - 0.5% ] 0.40% | 681,610 | 4.8% |
[ 0.0% - 0.5% ] 0.43% | 842,172 | 4.0% |
[ 0.0% - 0.5% ] 0.45% | 458,771 | 4.9% |
[ 0.0% - 0.5% ] 0.48% | 213,604 | 5.0% |
[ 0.5% - 1.0% ] 0.51% | 344,842 | 5.0% |
[ 0.5% - 1.0% ] 0.53% | 371,948 | 5.4% |
[ 0.5% - 1.0% ] 0.56% | 388,615 | 4.5% |
[ 0.5% - 1.0% ] 0.59% | 150,123 | 3.3% |
[ 0.5% - 1.0% ] 0.61% | 168,564 | 4.4% |
[ 0.5% - 1.0% ] 0.63% | 130,926 | 5.6% |
[ 0.5% - 1.0% ] 0.66% | 224,030 | 3.6% |
[ 0.5% - 1.0% ] 0.69% | 614,796 | 4.8% |
[ 0.5% - 1.0% ] 0.72% | 506,935 | 2.7% |
[ 0.5% - 1.0% ] 0.74% | 371,836 | 2.7% |
[ 0.5% - 1.0% ] 0.77% | 130,008 | 6.4% |
[ 0.5% - 1.0% ] 0.79% | 229,641 | 6.4% |
[ 0.5% - 1.0% ] 0.82% | 156,645 | 5.3% |
[ 0.5% - 1.0% ] 0.85% | 184,090 | 5.4% |
[ 0.5% - 1.0% ] 0.88% | 278,110 | 3.8% |
[ 0.5% - 1.0% ] 0.90% | 129,055 | 4.5% |
[ 0.5% - 1.0% ] 0.93% | 164,560 | 4.1% |
[ 0.5% - 1.0% ] 0.94% | 44,196 | 1.2% |
[ 0.5% - 1.0% ] 0.98% | 122,245 | 6.2% |
[ 0.5% - 1.0% ] 1.00% | 168,954 | 2.8% |
[ 1.0% - 1.5% ] 1.02% | 110,301 | 5.5% |
[ 1.0% - 1.5% ] 1.06% | 157,605 | 2.8% |
[ 1.0% - 1.5% ] 1.08% | 66,165 | 4.6% |
[ 1.0% - 1.5% ] 1.11% | 175,613 | 2.9% |
[ 1.0% - 1.5% ] 1.13% | 125,720 | 2.9% |
[ 1.0% - 1.5% ] 1.16% | 122,188 | 3.7% |
[ 1.0% - 1.5% ] 1.19% | 92,104 | 3.5% |
[ 1.0% - 1.5% ] 1.21% | 86,266 | 4.1% |
[ 1.0% - 1.5% ] 1.25% | 65,709 | 4.3% |
[ 1.0% - 1.5% ] 1.30% | 26,488 | 3.0% |
[ 1.0% - 1.5% ] 1.31% | 83,752 | 8.8% |
[ 1.0% - 1.5% ] 1.33% | 43,682 | 3.0% |
[ 1.0% - 1.5% ] 1.37% | 55,344 | 6.8% |
[ 1.0% - 1.5% ] 1.39% | 175,179 | 3.9% |
[ 1.0% - 1.5% ] 1.42% | 146,188 | 3.5% |
[ 1.0% - 1.5% ] 1.44% | 204,191 | 3.4% |
[ 1.0% - 1.5% ] 1.47% | 100,388 | 3.7% |
[ 1.0% - 1.5% ] 1.49% | 211,068 | 7.3% |
[ 1.5% - 2.0% ] 1.53% | 73,170 | 3.8% |
[ 1.5% - 2.0% ] 1.54% | 44,039 | 3.8% |
[ 1.5% - 2.0% ] 1.57% | 91,687 | 0.42% |
[ 1.5% - 2.0% ] 1.60% | 35,211 | 2.8% |
[ 1.5% - 2.0% ] 1.62% | 41,356 | 3.1% |
[ 1.5% - 2.0% ] 1.65% | 17,305 | 6.4% |
[ 1.5% - 2.0% ] 1.69% | 40,254 | 5.6% |
[ 1.5% - 2.0% ] 1.73% | 92,572 | 3.6% |
[ 1.5% - 2.0% ] 1.75% | 55,127 | 1.5% |
[ 1.5% - 2.0% ] 1.78% | 61,164 | 2.7% |
[ 1.5% - 2.0% ] 1.87% | 23,256 | 4.3% |
[ 1.5% - 2.0% ] 1.88% | 5,325 | 4.0% |
[ 1.5% - 2.0% ] 1.92% | 108,261 | 6.0% |
[ 1.5% - 2.0% ] 1.96% | 9,069 | 5.3% |
[ 1.5% - 2.0% ] 1.99% | 66,150 | 3.5% |
[ 2.0% - 2.5% ] 2.01% | 24,728 | 10.0% |
[ 2.0% - 2.5% ] 2.06% | 21,723 | 7.4% |
[ 2.0% - 2.5% ] 2.09% | 44,921 | 4.3% |
[ 2.0% - 2.5% ] 2.14% | 60,883 | 7.1% |
[ 2.0% - 2.5% ] 2.17% | 105,521 | 1.2% |
[ 2.0% - 2.5% ] 2.20% | 28,248 | 8.1% |
[ 2.0% - 2.5% ] 2.22% | 3,061 | 1.6% |
[ 2.0% - 2.5% ] 2.24% | 23,540 | 7.2% |
[ 2.0% - 2.5% ] 2.34% | 20,678 | 4.6% |
[ 2.0% - 2.5% ] 2.41% | 9,826 | 3.1% |
[ 2.5% - 3.0% ] 2.57% | 3,700 | 11.9% |
[ 2.5% - 3.0% ] 2.59% | 84,827 | 6.8% |
[ 2.5% - 3.0% ] 2.73% | 9,387 | 7.4% |
[ 2.5% - 3.0% ] 2.94% | 2,688 | 3.0% |
[ 3.0% - 3.5% ] 3.06% | 29,215 | 5.8% |
[ 3.0% - 3.5% ] 3.09% | 7,213 | 12.0% |
[ 3.0% - 3.5% ] 3.12% | 38,062 | 0.98% |
[ 3.0% - 3.5% ] 3.17% | 695 | 0.96% |
[ 3.0% - 3.5% ] 3.21% | 7,987 | 5.2% |
[ 3.0% - 3.5% ] 3.36% | 2,353 | 3.5% |
[ 4.0% - 4.5% ] 4.28% | 23,200 | 8.0% |
[ 4.5% - 5.0% ] 4.99% | 25,869 | 4.2% |