Cypriot Unemployment Among Women with Children Ages 6 to 17 years

COMPARE

Cypriot
Race
Ancestry
AfghanAfricanAlaska NativeAlaskan AthabascanAlbanianAleutAlsatianAmericanApacheArabArapahoArgentineanArmenianAssyrian/Chaldean/SyriacAustralianAustrianBahamianBangladeshiBarbadianBasqueBelgianBelizeanBermudanBhutaneseBlackfeetBolivianBrazilianBritishBritish West IndianBulgarianBurmeseCajunCambodianCanadianCape VerdeanCarpatho RusynCelticCentral AmericanCentral American IndianCherokeeCheyenneChickasawChileanChineseChippewaChoctawColombianColvilleComancheCosta RicanCreeCreekCroatianCrowCubanCypriotCzechCzechoslovakianDanishDelawareDominicanDutchDutch West IndianEastern EuropeanEcuadorianEgyptianEnglishEstonianEthiopianEuropeanFijianFilipinoFinnishFrenchFrench American IndianFrench CanadianGermanGerman RussianGhanaianGreekGuamanian/ChamorroGuatemalanGuyaneseHaitianHmongHonduranHopiHoumaHungarianIcelanderIndian (Asian)IndonesianInupiatIranianIraqiIrishIroquoisIsraeliItalianJamaicanJapaneseJordanianKenyanKiowaKoreanLaotianLatvianLebaneseLiberianLithuanianLumbeeLuxembourgerMacedonianMalaysianMalteseMarshalleseMenomineeMexicanMexican American IndianMongolianMoroccanNative HawaiianNavajoNepaleseNew ZealanderNicaraguanNigerianNorthern EuropeanNorwegianOkinawanOsageOttawaPaiutePakistaniPalestinianPanamanianParaguayanPennsylvania GermanPeruvianPimaPolishPortuguesePotawatomiPuebloPuerto RicanPuget Sound SalishRomanianRussianSalvadoranSamoanScandinavianScotch-IrishScottishSeminoleSenegaleseSerbianShoshoneSierra LeoneanSiouxSlavicSlovakSloveneSomaliSouth AfricanSouth AmericanSouth American IndianSoviet UnionSpaniardSpanishSpanish AmericanSpanish American IndianSri LankanSubsaharan AfricanSudaneseSwedishSwissSyrianTaiwaneseThaiTlingit-HaidaTohono O'OdhamTonganTrinidadian and TobagonianTsimshianTurkishU.S. Virgin IslanderUgandanUkrainianUruguayanUteVenezuelanVietnameseWelshWest IndianYakamaYaquiYugoslavianYumanYup'ikZimbabwean
Immigration
NonimmigrantsImmigrantsAfghanistanAfricaAlbaniaArgentinaArmeniaAsiaAustraliaAustriaBahamasBangladeshBarbadosBelarusBelgiumBelizeBoliviaBosnia and HerzegovinaBrazilBulgariaBurma/MyanmarCabo VerdeCambodiaCameroonCanadaCaribbeanCentral AmericaChileChinaColombiaCongoCosta RicaCroatiaCubaCzechoslovakiaDenmarkDominicaDominican RepublicEastern AfricaEastern AsiaEastern EuropeEcuadorEgyptEl SalvadorEnglandEritreaEthiopiaEuropeFijiFranceGermanyGhanaGreeceGrenadaGuatemalaGuyanaHaitiHondurasHong KongHungaryIndiaIndonesiaIranIraqIrelandIsraelItalyJamaicaJapanJordanKazakhstanKenyaKoreaKuwaitLaosLatin AmericaLatviaLebanonLiberiaLithuaniaMalaysiaMexicoMicronesiaMiddle AfricaMoldovaMoroccoNepalNetherlandsNicaraguaNigeriaNorth AmericaNorth MacedoniaNorthern AfricaNorthern EuropeNorwayOceaniaPakistanPanamaPeruPhilippinesPolandPortugalRomaniaRussiaSaudi ArabiaScotlandSenegalSerbiaSierra LeoneSingaporeSomaliaSouth AfricaSouth AmericaSouth Central AsiaSouth Eastern AsiaSouthern EuropeSpainSri LankaSt. Vincent and the GrenadinesSudanSwedenSwitzerlandSyriaTaiwanThailandTrinidad and TobagoTurkeyUgandaUkraineUruguayUzbekistanVenezuelaVietnamWest IndiesWestern AfricaWestern AsiaWestern EuropeYemenZaireZimbabweAzores
Select to Compare
Race
Ancestry
AfghanAfricanAlaska NativeAlaskan AthabascanAlbanianAleutAlsatianAmericanApacheArabArapahoArgentineanArmenianAssyrian/Chaldean/SyriacAustralianAustrianBahamianBangladeshiBarbadianBasqueBelgianBelizeanBermudanBhutaneseBlackfeetBolivianBrazilianBritishBritish West IndianBulgarianBurmeseCajunCambodianCanadianCape VerdeanCarpatho RusynCelticCentral AmericanCentral American IndianCherokeeCheyenneChickasawChileanChineseChippewaChoctawColombianColvilleComancheCosta RicanCreeCreekCroatianCrowCubanCzechCzechoslovakianDanishDelawareDominicanDutchDutch West IndianEastern EuropeanEcuadorianEgyptianEnglishEstonianEthiopianEuropeanFijianFilipinoFinnishFrenchFrench American IndianFrench CanadianGermanGerman RussianGhanaianGreekGuamanian/ChamorroGuatemalanGuyaneseHaitianHmongHonduranHopiHoumaHungarianIcelanderIndian (Asian)IndonesianInupiatIranianIraqiIrishIroquoisIsraeliItalianJamaicanJapaneseJordanianKenyanKiowaKoreanLaotianLatvianLebaneseLiberianLithuanianLumbeeLuxembourgerMacedonianMalaysianMalteseMarshalleseMenomineeMexicanMexican American IndianMongolianMoroccanNative HawaiianNavajoNepaleseNew ZealanderNicaraguanNigerianNorthern EuropeanNorwegianOkinawanOsageOttawaPaiutePakistaniPalestinianPanamanianParaguayanPennsylvania GermanPeruvianPimaPolishPortuguesePotawatomiPuebloPuerto RicanPuget Sound SalishRomanianRussianSalvadoranSamoanScandinavianScotch-IrishScottishSeminoleSenegaleseSerbianShoshoneSierra LeoneanSiouxSlavicSlovakSloveneSomaliSouth AfricanSouth AmericanSouth American IndianSoviet UnionSpaniardSpanishSpanish AmericanSpanish American IndianSri LankanSubsaharan AfricanSudaneseSwedishSwissSyrianTaiwaneseThaiTlingit-HaidaTohono O'OdhamTonganTrinidadian and TobagonianTsimshianTurkishU.S. Virgin IslanderUgandanUkrainianUruguayanUteVenezuelanVietnameseWelshWest IndianYakamaYaquiYugoslavianYumanYup'ikZimbabwean
Immigration
NonimmigrantsImmigrantsAfghanistanAfricaAlbaniaArgentinaArmeniaAsiaAustraliaAustriaBahamasBangladeshBarbadosBelarusBelgiumBelizeBoliviaBosnia and HerzegovinaBrazilBulgariaBurma/MyanmarCabo VerdeCambodiaCameroonCanadaCaribbeanCentral AmericaChileChinaColombiaCongoCosta RicaCroatiaCubaCzechoslovakiaDenmarkDominicaDominican RepublicEastern AfricaEastern AsiaEastern EuropeEcuadorEgyptEl SalvadorEnglandEritreaEthiopiaEuropeFijiFranceGermanyGhanaGreeceGrenadaGuatemalaGuyanaHaitiHondurasHong KongHungaryIndiaIndonesiaIranIraqIrelandIsraelItalyJamaicaJapanJordanKazakhstanKenyaKoreaKuwaitLaosLatin AmericaLatviaLebanonLiberiaLithuaniaMalaysiaMexicoMicronesiaMiddle AfricaMoldovaMoroccoNepalNetherlandsNicaraguaNigeriaNorth AmericaNorth MacedoniaNorthern AfricaNorthern EuropeNorwayOceaniaPakistanPanamaPeruPhilippinesPolandPortugalRomaniaRussiaSaudi ArabiaScotlandSenegalSerbiaSierra LeoneSingaporeSomaliaSouth AfricaSouth AmericaSouth Central AsiaSouth Eastern AsiaSouthern EuropeSpainSri LankaSt. Vincent and the GrenadinesSudanSwedenSwitzerlandSyriaTaiwanThailandTrinidad and TobagoTurkeyUgandaUkraineUruguayUzbekistanVenezuelaVietnamWest IndiesWestern AfricaWestern AsiaWestern EuropeYemenZaireZimbabweAzores
Unemployment Among Women with Children Ages 6 to 17 years
Income
Poverty
Unemployment
Labor Participation
Family Structure
Vehicle Availability
Education Level
Disability

Cypriot Unemployment Among Women with Children Ages 6 to 17 years
Exceptional

8.4%
UNEMPLOYMENT | WOMEN W/ CHILDREN 6 TO 17
99.6/ 100
METRIC RATING
82nd/ 347
METRIC RANK

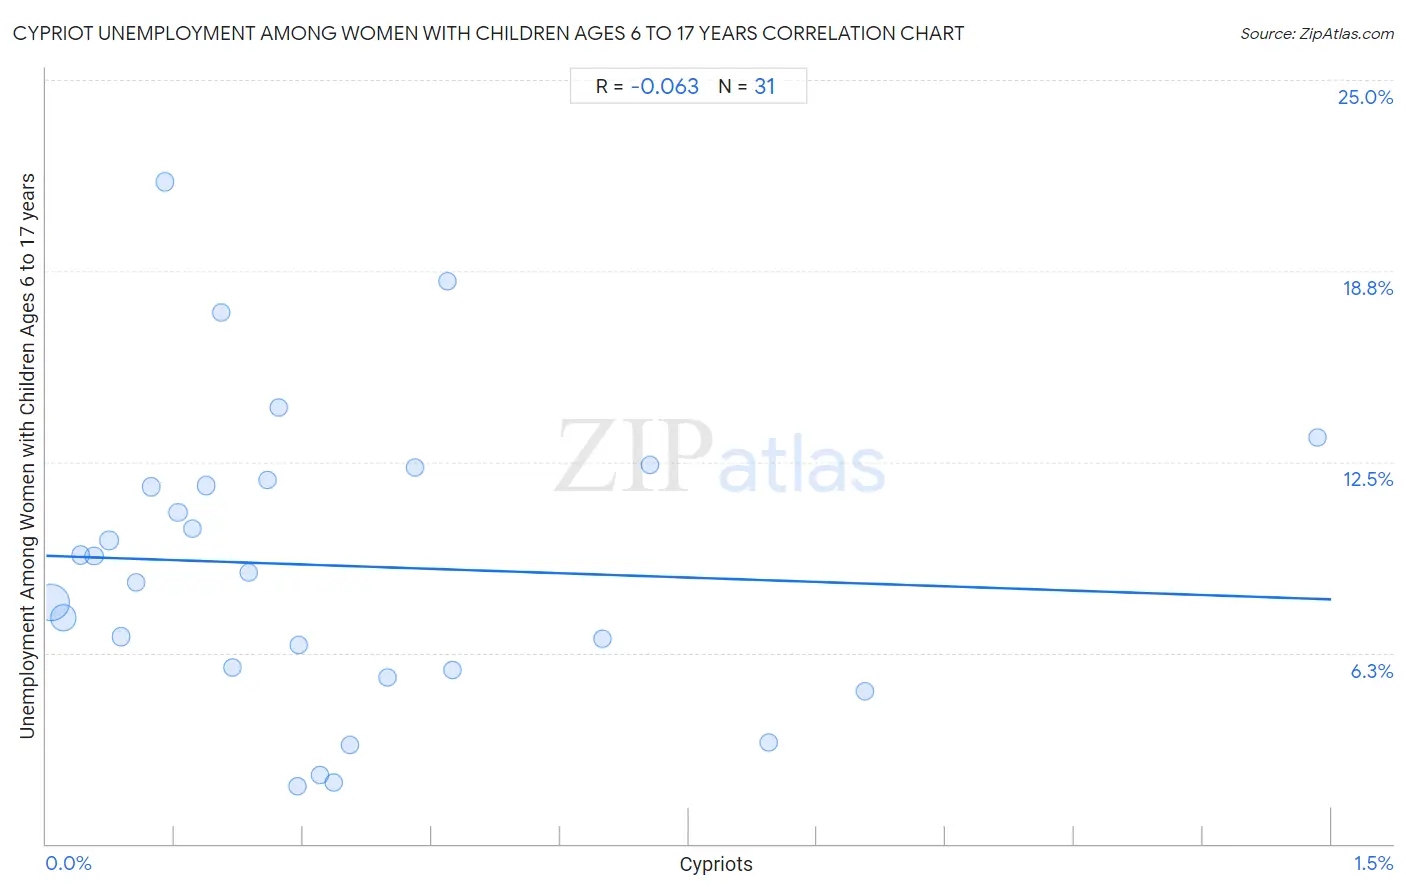
Cypriot Unemployment Among Women with Children Ages 6 to 17 years Correlation Chart

The statistical analysis conducted on geographies consisting of 54,065,286 people shows a slight negative correlation between the proportion of Cypriots and unemployment rate among women with children between the ages 6 and 17 in the United States with a correlation coefficient (R) of -0.063 and weighted average of 8.4%. On average, for every 1% (one percent) increase in Cypriots within a typical geography, there is a decrease of 0.95% in unemployment rate among women with children between the ages 6 and 17.
Cypriot Unemployment Among Women with Children Ages 6 to 17 years
It is essential to understand that the correlation between the percentage of Cypriots and unemployment rate among women with children between the ages 6 and 17 does not imply a direct cause-and-effect relationship. It remains uncertain whether the presence of Cypriots influences an upward or downward trend in the level of unemployment rate among women with children between the ages 6 and 17 within an area, or if Cypriots simply ended up residing in those areas with higher or lower levels of unemployment rate among women with children between the ages 6 and 17 due to other factors.

Demographics Similar to Cypriots by Unemployment Among Women with Children Ages 6 to 17 years

In terms of unemployment among women with children ages 6 to 17 years, the demographic groups most similar to Cypriots are Immigrants from Bolivia (8.4%, a difference of 0.020%), Immigrants from Belarus (8.4%, a difference of 0.14%), Bulgarian (8.4%, a difference of 0.16%), Mongolian (8.4%, a difference of 0.18%), and Pakistani (8.4%, a difference of 0.19%).
DemographicsRating | RankUnemployment Among Women with Children Ages 6 to 17 years
Immigrants from Sri Lanka
99.7
/100
|
#75
Exceptional
8.4%
Immigrants from Moldova
99.7
/100
|
#76
Exceptional
8.4%
Iraqis
99.7
/100
|
#77
Exceptional
8.4%
Pakistanis
99.6
/100
|
#78
Exceptional
8.4%
Mongolians
99.6
/100
|
#79
Exceptional
8.4%
Immigrants from Belarus
99.6
/100
|
#80
Exceptional
8.4%
Immigrants from Bolivia
99.6
/100
|
#81
Exceptional
8.4%
Cypriots
99.6
/100
|
#82
Exceptional
8.4%
Bulgarians
99.5
/100
|
#83
Exceptional
8.4%
Japanese
99.5
/100
|
#84
Exceptional
8.4%
Immigrants from North Macedonia
99.4
/100
|
#85
Exceptional
8.5%
Alaskan Athabascans
99.4
/100
|
#86
Exceptional
8.5%
Immigrants from Israel
99.1
/100
|
#87
Exceptional
8.5%
Immigrants from Vietnam
99.1
/100
|
#88
Exceptional
8.5%
Paiute
99.1
/100
|
#89
Exceptional
8.5%

Cypriot Unemployment Among Women with Children Ages 6 to 17 years Correlation Summary

MeasurementCypriot DataUnemployment Among Women with Children Ages 6 to 17 years Data
Minimum0.0053%1.9%
Maximum1.5%21.7%
Range1.5%19.8%
Mean0.33%9.1%
Median0.26%8.9%
Interquartile 25% (IQ1)0.12%5.7%
Interquartile 75% (IQ3)0.43%11.9%
Interquartile Range (IQR)0.31%6.2%
Standard Deviation (Sample)0.32%4.8%
Standard Deviation (Population)0.31%4.7%

Correlation Details

Cypriot PercentileSample SizeUnemployment Among Women with Children Ages 6 to 17 years
[
0.0%
-
0.5%
]
0.0053%
33,168,7367.9%
[
0.0%
-
0.5%
]
0.020%
14,612,8327.4%
[
0.0%
-
0.5%
]
0.040%
2,014,4869.4%
[
0.0%
-
0.5%
]
0.056%
972,0209.4%
[
0.0%
-
0.5%
]
0.073%
862,5829.9%
[
0.0%
-
0.5%
]
0.087%
596,6186.8%
[
0.0%
-
0.5%
]
0.10%
292,9938.6%
[
0.0%
-
0.5%
]
0.12%
242,11511.7%
[
0.0%
-
0.5%
]
0.14%
86,98921.7%
[
0.0%
-
0.5%
]
0.15%
139,02310.9%
[
0.0%
-
0.5%
]
0.17%
167,12310.3%
[
0.0%
-
0.5%
]
0.19%
170,31111.7%
[
0.0%
-
0.5%
]
0.20%
49,27517.4%
[
0.0%
-
0.5%
]
0.22%
45,8885.7%
[
0.0%
-
0.5%
]
0.24%
57,8378.9%
[
0.0%
-
0.5%
]
0.26%
36,41811.9%
[
0.0%
-
0.5%
]
0.27%
26,11614.3%
[
0.0%
-
0.5%
]
0.29%
29,7051.9%
[
0.0%
-
0.5%
]
0.30%
73,5086.5%
[
0.0%
-
0.5%
]
0.32%
67,2172.3%
[
0.0%
-
0.5%
]
0.34%
24,6922.0%
[
0.0%
-
0.5%
]
0.35%
77,4933.2%
[
0.0%
-
0.5%
]
0.40%
47,6375.4%
[
0.0%
-
0.5%
]
0.43%
31,09112.3%
[
0.0%
-
0.5%
]
0.47%
19,23918.4%
[
0.0%
-
0.5%
]
0.47%
35,3805.7%
[
0.5%
-
1.0%
]
0.65%
9,2346.7%
[
0.5%
-
1.0%
]
0.71%
36,02812.4%
[
0.5%
-
1.0%
]
0.84%
18,7483.3%
[
0.5%
-
1.0%
]
0.96%
36,8425.0%
[
1.0%
-
1.5%
]
1.48%
17,11013.3%