Immigrants from Burma/Myanmar Unemployment Among Women with Children Under 6 years

COMPARE

Immigrants from Burma/Myanmar
Race
Ancestry
AfghanAfricanAlaska NativeAlaskan AthabascanAlbanianAleutAlsatianAmericanApacheArabArapahoArgentineanArmenianAssyrian/Chaldean/SyriacAustralianAustrianBahamianBangladeshiBarbadianBasqueBelgianBelizeanBermudanBhutaneseBlackfeetBolivianBrazilianBritishBritish West IndianBulgarianBurmeseCajunCambodianCanadianCape VerdeanCarpatho RusynCelticCentral AmericanCentral American IndianCherokeeCheyenneChickasawChileanChineseChippewaChoctawColombianColvilleComancheCosta RicanCreeCreekCroatianCrowCubanCypriotCzechCzechoslovakianDanishDelawareDominicanDutchDutch West IndianEastern EuropeanEcuadorianEgyptianEnglishEstonianEthiopianEuropeanFijianFilipinoFinnishFrenchFrench American IndianFrench CanadianGermanGerman RussianGhanaianGreekGuamanian/ChamorroGuatemalanGuyaneseHaitianHmongHonduranHopiHoumaHungarianIcelanderIndian (Asian)IndonesianInupiatIranianIraqiIrishIroquoisIsraeliItalianJamaicanJapaneseJordanianKenyanKiowaKoreanLaotianLatvianLebaneseLiberianLithuanianLumbeeLuxembourgerMacedonianMalaysianMalteseMarshalleseMenomineeMexicanMexican American IndianMongolianMoroccanNative HawaiianNavajoNepaleseNew ZealanderNicaraguanNigerianNorthern EuropeanNorwegianOkinawanOsageOttawaPaiutePakistaniPalestinianPanamanianParaguayanPennsylvania GermanPeruvianPimaPolishPortuguesePotawatomiPuebloPuerto RicanPuget Sound SalishRomanianRussianSalvadoranSamoanScandinavianScotch-IrishScottishSeminoleSenegaleseSerbianShoshoneSierra LeoneanSiouxSlavicSlovakSloveneSomaliSouth AfricanSouth AmericanSouth American IndianSoviet UnionSpaniardSpanishSpanish AmericanSpanish American IndianSri LankanSubsaharan AfricanSudaneseSwedishSwissSyrianTaiwaneseThaiTlingit-HaidaTohono O'OdhamTonganTrinidadian and TobagonianTsimshianTurkishU.S. Virgin IslanderUgandanUkrainianUruguayanUteVenezuelanVietnameseWelshWest IndianYakamaYaquiYugoslavianYumanYup'ikZimbabwean
Immigration
NonimmigrantsImmigrantsAfghanistanAfricaAlbaniaArgentinaArmeniaAsiaAustraliaAustriaBahamasBangladeshBarbadosBelarusBelgiumBelizeBoliviaBosnia and HerzegovinaBrazilBulgariaBurma/MyanmarCabo VerdeCambodiaCameroonCanadaCaribbeanCentral AmericaChileChinaColombiaCongoCosta RicaCroatiaCubaCzechoslovakiaDenmarkDominicaDominican RepublicEastern AfricaEastern AsiaEastern EuropeEcuadorEgyptEl SalvadorEnglandEritreaEthiopiaEuropeFijiFranceGermanyGhanaGreeceGrenadaGuatemalaGuyanaHaitiHondurasHong KongHungaryIndiaIndonesiaIranIraqIrelandIsraelItalyJamaicaJapanJordanKazakhstanKenyaKoreaKuwaitLaosLatin AmericaLatviaLebanonLiberiaLithuaniaMalaysiaMexicoMicronesiaMiddle AfricaMoldovaMoroccoNepalNetherlandsNicaraguaNigeriaNorth AmericaNorth MacedoniaNorthern AfricaNorthern EuropeNorwayOceaniaPakistanPanamaPeruPhilippinesPolandPortugalRomaniaRussiaSaudi ArabiaScotlandSenegalSerbiaSierra LeoneSingaporeSomaliaSouth AfricaSouth AmericaSouth Central AsiaSouth Eastern AsiaSouthern EuropeSpainSri LankaSt. Vincent and the GrenadinesSudanSwedenSwitzerlandSyriaTaiwanThailandTrinidad and TobagoTurkeyUgandaUkraineUruguayUzbekistanVenezuelaVietnamWest IndiesWestern AfricaWestern AsiaWestern EuropeYemenZaireZimbabweAzores
Select to Compare
Race
Ancestry
AfghanAfricanAlaska NativeAlaskan AthabascanAlbanianAleutAlsatianAmericanApacheArabArapahoArgentineanArmenianAssyrian/Chaldean/SyriacAustralianAustrianBahamianBangladeshiBarbadianBasqueBelgianBelizeanBermudanBhutaneseBlackfeetBolivianBrazilianBritishBritish West IndianBulgarianBurmeseCajunCambodianCanadianCape VerdeanCarpatho RusynCelticCentral AmericanCentral American IndianCherokeeCheyenneChickasawChileanChineseChippewaChoctawColombianColvilleComancheCosta RicanCreeCreekCroatianCrowCubanCypriotCzechCzechoslovakianDanishDelawareDominicanDutchDutch West IndianEastern EuropeanEcuadorianEgyptianEnglishEstonianEthiopianEuropeanFijianFilipinoFinnishFrenchFrench American IndianFrench CanadianGermanGerman RussianGhanaianGreekGuamanian/ChamorroGuatemalanGuyaneseHaitianHmongHonduranHopiHoumaHungarianIcelanderIndian (Asian)IndonesianInupiatIranianIraqiIrishIroquoisIsraeliItalianJamaicanJapaneseJordanianKenyanKiowaKoreanLaotianLatvianLebaneseLiberianLithuanianLumbeeLuxembourgerMacedonianMalaysianMalteseMarshalleseMenomineeMexicanMexican American IndianMongolianMoroccanNative HawaiianNavajoNepaleseNew ZealanderNicaraguanNigerianNorthern EuropeanNorwegianOkinawanOsageOttawaPaiutePakistaniPalestinianPanamanianParaguayanPennsylvania GermanPeruvianPimaPolishPortuguesePotawatomiPuebloPuerto RicanPuget Sound SalishRomanianRussianSalvadoranSamoanScandinavianScotch-IrishScottishSeminoleSenegaleseSerbianShoshoneSierra LeoneanSiouxSlavicSlovakSloveneSomaliSouth AfricanSouth AmericanSouth American IndianSoviet UnionSpaniardSpanishSpanish AmericanSpanish American IndianSri LankanSubsaharan AfricanSudaneseSwedishSwissSyrianTaiwaneseThaiTlingit-HaidaTohono O'OdhamTonganTrinidadian and TobagonianTsimshianTurkishU.S. Virgin IslanderUgandanUkrainianUruguayanUteVenezuelanVietnameseWelshWest IndianYakamaYaquiYugoslavianYumanYup'ikZimbabwean
Immigration
NonimmigrantsImmigrantsAfghanistanAfricaAlbaniaArgentinaArmeniaAsiaAustraliaAustriaBahamasBangladeshBarbadosBelarusBelgiumBelizeBoliviaBosnia and HerzegovinaBrazilBulgariaCabo VerdeCambodiaCameroonCanadaCaribbeanCentral AmericaChileChinaColombiaCongoCosta RicaCroatiaCubaCzechoslovakiaDenmarkDominicaDominican RepublicEastern AfricaEastern AsiaEastern EuropeEcuadorEgyptEl SalvadorEnglandEritreaEthiopiaEuropeFijiFranceGermanyGhanaGreeceGrenadaGuatemalaGuyanaHaitiHondurasHong KongHungaryIndiaIndonesiaIranIraqIrelandIsraelItalyJamaicaJapanJordanKazakhstanKenyaKoreaKuwaitLaosLatin AmericaLatviaLebanonLiberiaLithuaniaMalaysiaMexicoMicronesiaMiddle AfricaMoldovaMoroccoNepalNetherlandsNicaraguaNigeriaNorth AmericaNorth MacedoniaNorthern AfricaNorthern EuropeNorwayOceaniaPakistanPanamaPeruPhilippinesPolandPortugalRomaniaRussiaSaudi ArabiaScotlandSenegalSerbiaSierra LeoneSingaporeSomaliaSouth AfricaSouth AmericaSouth Central AsiaSouth Eastern AsiaSouthern EuropeSpainSri LankaSt. Vincent and the GrenadinesSudanSwedenSwitzerlandSyriaTaiwanThailandTrinidad and TobagoTurkeyUgandaUkraineUruguayUzbekistanVenezuelaVietnamWest IndiesWestern AfricaWestern AsiaWestern EuropeYemenZaireZimbabweAzores
Unemployment Among Women with Children Under 6 years
Income
Poverty
Unemployment
Labor Participation
Family Structure
Vehicle Availability
Education Level
Disability

Immigrants from Burma/Myanmar Unemployment Among Women with Children Under 6 years
Exceptional

7.3%
UNEMPLOYMENT | WOMEN W/ CHILDREN < 6
91.9/ 100
METRIC RATING
126th/ 347
METRIC RANK

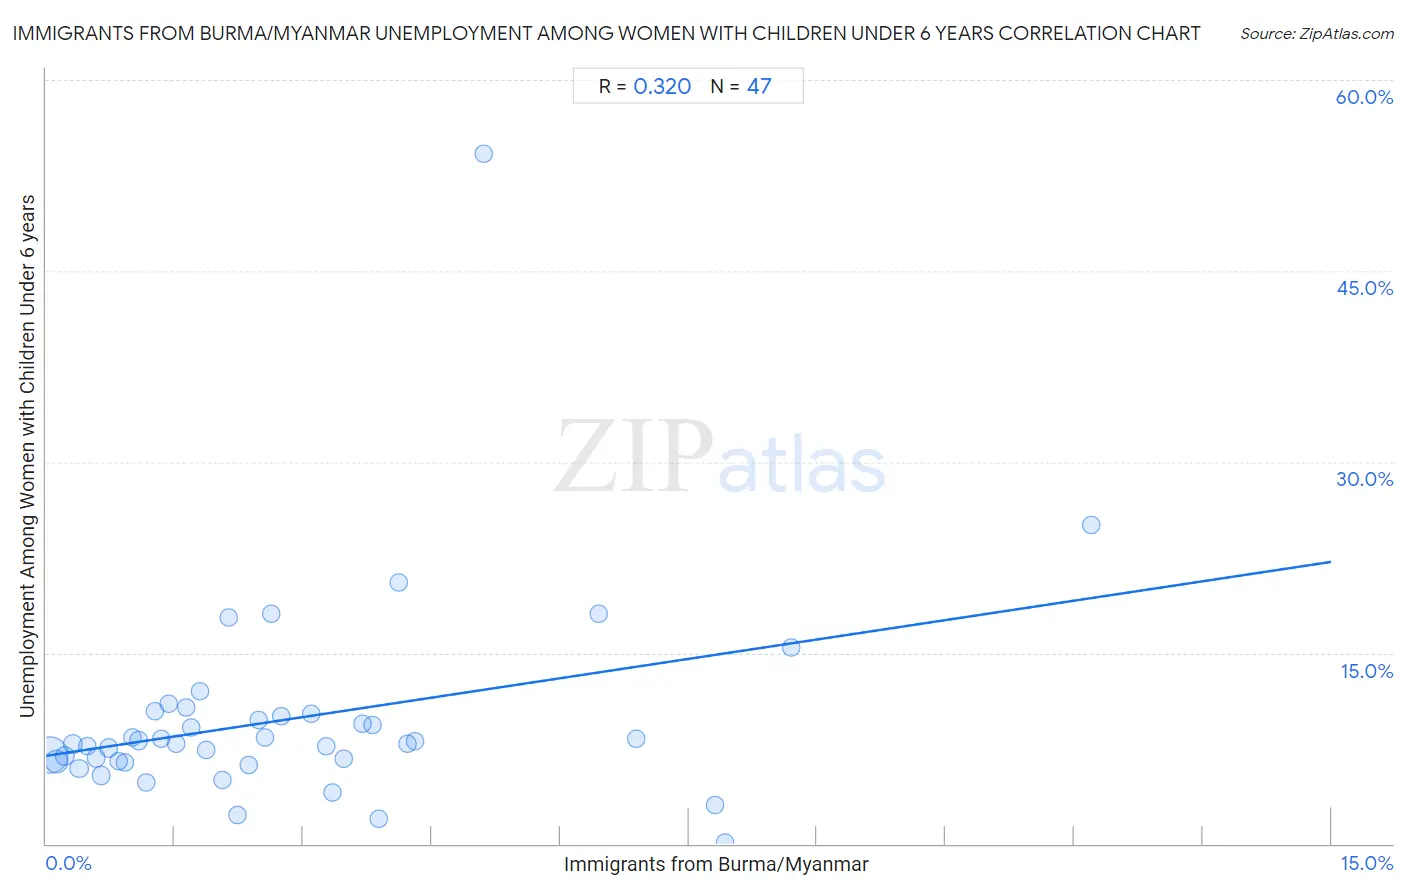
Immigrants from Burma/Myanmar Unemployment Among Women with Children Under 6 years Correlation Chart

The statistical analysis conducted on geographies consisting of 151,981,600 people shows a mild positive correlation between the proportion of Immigrants from Burma/Myanmar and unemployment rate among women with children under the age of 6 in the United States with a correlation coefficient (R) of 0.320 and weighted average of 7.3%. On average, for every 1% (one percent) increase in Immigrants from Burma/Myanmar within a typical geography, there is an increase of 1.0% in unemployment rate among women with children under the age of 6.
Immigrants from Burma/Myanmar Unemployment Among Women with Children Under 6 years
It is essential to understand that the correlation between the percentage of Immigrants from Burma/Myanmar and unemployment rate among women with children under the age of 6 does not imply a direct cause-and-effect relationship. It remains uncertain whether the presence of Immigrants from Burma/Myanmar influences an upward or downward trend in the level of unemployment rate among women with children under the age of 6 within an area, or if Immigrants from Burma/Myanmar simply ended up residing in those areas with higher or lower levels of unemployment rate among women with children under the age of 6 due to other factors.

Demographics Similar to Immigrants from Burma/Myanmar by Unemployment Among Women with Children Under 6 years

In terms of unemployment among women with children under 6 years, the demographic groups most similar to Immigrants from Burma/Myanmar are Pakistani (7.3%, a difference of 0.070%), Jordanian (7.3%, a difference of 0.10%), Zimbabwean (7.3%, a difference of 0.10%), Immigrants from South Africa (7.3%, a difference of 0.15%), and Immigrants from Zaire (7.3%, a difference of 0.34%).
DemographicsRating | RankUnemployment Among Women with Children Under 6 years
South Africans
94.1
/100
|
#119
Exceptional
7.3%
Iraqis
93.9
/100
|
#120
Exceptional
7.3%
Immigrants from Chile
93.5
/100
|
#121
Exceptional
7.3%
Immigrants from Bosnia and Herzegovina
93.5
/100
|
#122
Exceptional
7.3%
Immigrants from Zaire
93.3
/100
|
#123
Exceptional
7.3%
Immigrants from South Africa
92.5
/100
|
#124
Exceptional
7.3%
Pakistanis
92.2
/100
|
#125
Exceptional
7.3%
Immigrants from Burma/Myanmar
91.9
/100
|
#126
Exceptional
7.3%
Jordanians
91.5
/100
|
#127
Exceptional
7.3%
Zimbabweans
91.5
/100
|
#128
Exceptional
7.3%
Slovenes
89.2
/100
|
#129
Excellent
7.4%
Swedes
88.4
/100
|
#130
Excellent
7.4%
Ukrainians
88.2
/100
|
#131
Excellent
7.4%
Immigrants from Armenia
87.4
/100
|
#132
Excellent
7.4%
Immigrants from Uganda
86.5
/100
|
#133
Excellent
7.4%

Immigrants from Burma/Myanmar Unemployment Among Women with Children Under 6 years Correlation Summary

MeasurementImmigrants from Burma/Myanmar DataUnemployment Among Women with Children Under 6 years Data
Minimum0.038%0.10%
Maximum12.2%54.2%
Range12.2%54.1%
Mean2.8%9.8%
Median2.1%7.9%
Interquartile 25% (IQ1)1.0%6.5%
Interquartile 75% (IQ3)3.8%10.2%
Interquartile Range (IQR)2.8%3.7%
Standard Deviation (Sample)2.6%8.2%
Standard Deviation (Population)2.5%8.1%

Correlation Details

Immigrants from Burma/Myanmar PercentileSample SizeUnemployment Among Women with Children Under 6 years
[
0.0%
-
0.5%
]
0.038%
100,721,2836.9%
[
0.0%
-
0.5%
]
0.12%
23,138,0786.5%
[
0.0%
-
0.5%
]
0.22%
8,955,5496.9%
[
0.0%
-
0.5%
]
0.31%
3,558,1357.8%
[
0.0%
-
0.5%
]
0.38%
2,573,3685.9%
[
0.0%
-
0.5%
]
0.48%
2,038,7437.7%
[
0.5%
-
1.0%
]
0.58%
1,989,7466.7%
[
0.5%
-
1.0%
]
0.64%
1,309,7965.4%
[
0.5%
-
1.0%
]
0.73%
1,019,7217.5%
[
0.5%
-
1.0%
]
0.84%
1,060,1546.5%
[
0.5%
-
1.0%
]
0.92%
547,5096.4%
[
1.0%
-
1.5%
]
1.00%
451,9408.3%
[
1.0%
-
1.5%
]
1.08%
1,189,0418.1%
[
1.0%
-
1.5%
]
1.17%
297,7804.9%
[
1.0%
-
1.5%
]
1.27%
256,01510.4%
[
1.0%
-
1.5%
]
1.34%
180,0238.3%
[
1.0%
-
1.5%
]
1.43%
239,05211.0%
[
1.5%
-
2.0%
]
1.51%
247,2537.9%
[
1.5%
-
2.0%
]
1.63%
340,36510.7%
[
1.5%
-
2.0%
]
1.69%
139,8439.2%
[
1.5%
-
2.0%
]
1.80%
92,79912.0%
[
1.5%
-
2.0%
]
1.86%
409,4167.4%
[
2.0%
-
2.5%
]
2.06%
239,8845.0%
[
2.0%
-
2.5%
]
2.13%
24,02817.8%
[
2.0%
-
2.5%
]
2.23%
31,0472.3%
[
2.0%
-
2.5%
]
2.37%
42,5156.2%
[
2.0%
-
2.5%
]
2.48%
130,8179.7%
[
2.5%
-
3.0%
]
2.55%
122,5378.4%
[
2.5%
-
3.0%
]
2.63%
45,55018.1%
[
2.5%
-
3.0%
]
2.75%
78,42010.0%
[
3.0%
-
3.5%
]
3.09%
64,72810.2%
[
3.0%
-
3.5%
]
3.27%
31,9767.7%
[
3.0%
-
3.5%
]
3.35%
13,4214.0%
[
3.0%
-
3.5%
]
3.47%
57,5876.7%
[
3.5%
-
4.0%
]
3.70%
23,9809.4%
[
3.5%
-
4.0%
]
3.81%
57,6629.3%
[
3.5%
-
4.0%
]
3.88%
15,8992.0%
[
4.0%
-
4.5%
]
4.12%
25,69920.5%
[
4.0%
-
4.5%
]
4.21%
23,8797.9%
[
4.0%
-
4.5%
]
4.31%
54,3318.0%
[
5.0%
-
5.5%
]
5.11%
5,26854.2%
[
6.0%
-
6.5%
]
6.45%
19,50118.1%
[
6.5%
-
7.0%
]
6.88%
19,6138.2%
[
7.5%
-
8.0%
]
7.81%
39,0823.0%
[
7.5%
-
8.0%
]
7.92%
56,7940.10%
[
8.5%
-
9.0%
]
8.70%
1,03515.4%
[
12.0%
-
12.5%
]
12.20%
73825.0%