Immigrants from Burma/Myanmar Unemployment
COMPARE
Immigrants from Burma/Myanmar
Select to Compare
Unemployment
Immigrants from Burma/Myanmar Unemployment
5.1%
UNEMPLOYMENT
86.2/ 100
METRIC RATING
135th/ 347
METRIC RANK
Immigrants from Burma/Myanmar Unemployment Correlation Chart
The statistical analysis conducted on geographies consisting of 172,291,734 people shows a mild positive correlation between the proportion of Immigrants from Burma/Myanmar and unemployment in the United States with a correlation coefficient (R) of 0.312 and weighted average of 5.1%. On average, for every 1% (one percent) increase in Immigrants from Burma/Myanmar within a typical geography, there is an increase of 0.19% in unemployment.
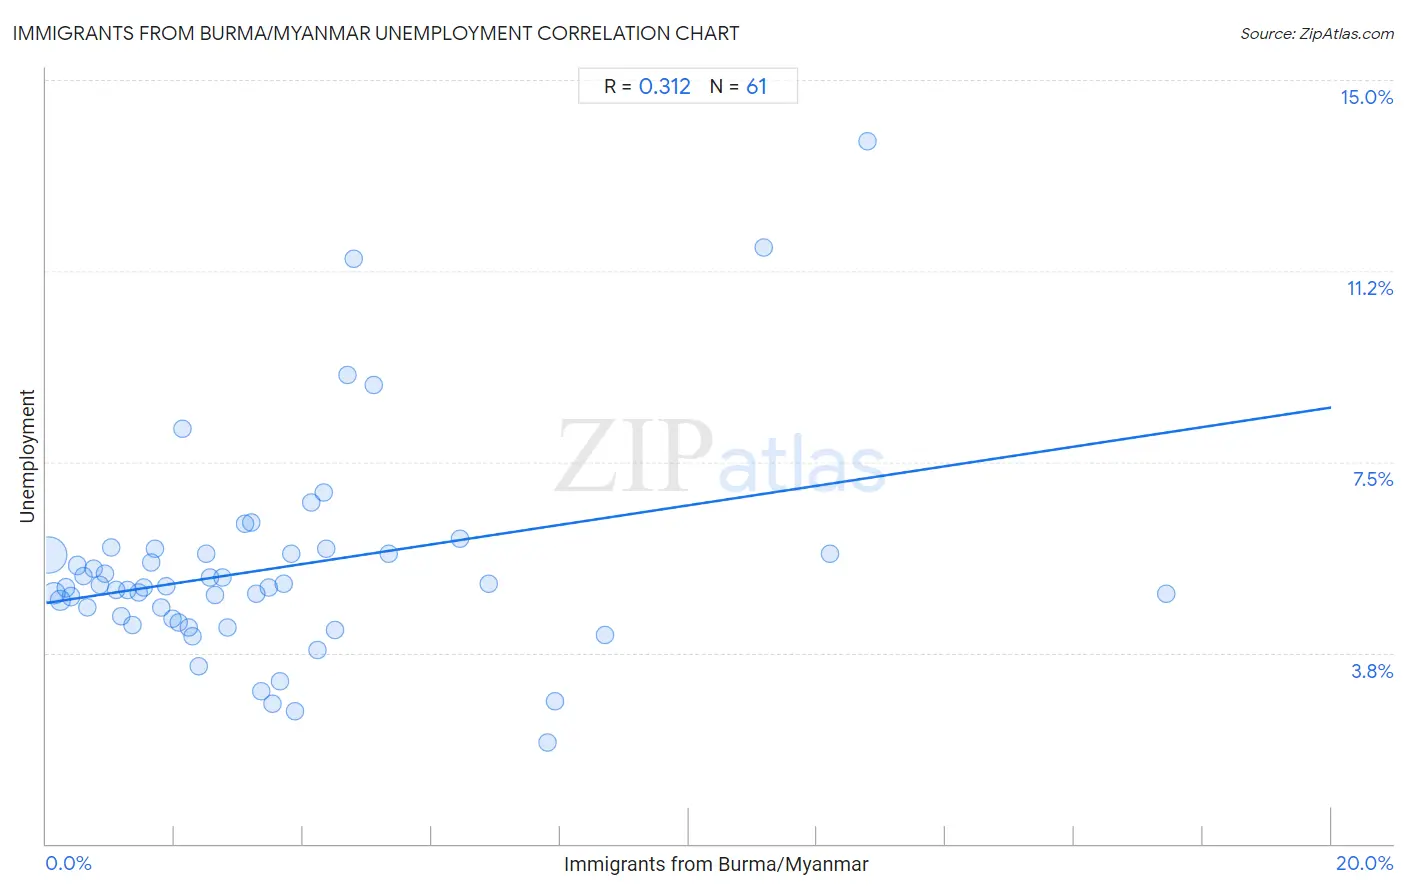
It is essential to understand that the correlation between the percentage of Immigrants from Burma/Myanmar and unemployment does not imply a direct cause-and-effect relationship. It remains uncertain whether the presence of Immigrants from Burma/Myanmar influences an upward or downward trend in the level of unemployment within an area, or if Immigrants from Burma/Myanmar simply ended up residing in those areas with higher or lower levels of unemployment due to other factors.
Demographics Similar to Immigrants from Burma/Myanmar by Unemployment
In terms of unemployment, the demographic groups most similar to Immigrants from Burma/Myanmar are Immigrants from Europe (5.1%, a difference of 0.010%), Immigrants from Spain (5.1%, a difference of 0.010%), Immigrants from Jordan (5.1%, a difference of 0.050%), Immigrants from Ethiopia (5.1%, a difference of 0.060%), and Immigrants from Croatia (5.1%, a difference of 0.070%).
| Demographics | Rating | Rank | Unemployment |
| Immigrants from Eastern Africa | 88.1 /100 | #128 | Excellent 5.1% |
| Immigrants from Latvia | 88.0 /100 | #129 | Excellent 5.1% |
| Iranians | 86.9 /100 | #130 | Excellent 5.1% |
| Immigrants from Croatia | 86.8 /100 | #131 | Excellent 5.1% |
| Immigrants from Ethiopia | 86.7 /100 | #132 | Excellent 5.1% |
| Immigrants from Jordan | 86.6 /100 | #133 | Excellent 5.1% |
| Immigrants from Europe | 86.3 /100 | #134 | Excellent 5.1% |
| Immigrants from Burma/Myanmar | 86.2 /100 | #135 | Excellent 5.1% |
| Immigrants from Spain | 86.2 /100 | #136 | Excellent 5.1% |
| Immigrants from Saudi Arabia | 85.6 /100 | #137 | Excellent 5.1% |
| Immigrants from Hungary | 85.6 /100 | #138 | Excellent 5.1% |
| Pakistanis | 85.3 /100 | #139 | Excellent 5.1% |
| Immigrants from Denmark | 84.3 /100 | #140 | Excellent 5.1% |
| Palestinians | 83.4 /100 | #141 | Excellent 5.1% |
| Immigrants from Pakistan | 83.2 /100 | #142 | Excellent 5.1% |
Immigrants from Burma/Myanmar Unemployment Correlation Summary
| Measurement | Immigrants from Burma/Myanmar Data | Unemployment Data |
| Minimum | 0.038% | 2.0% |
| Maximum | 17.4% | 13.8% |
| Range | 17.4% | 11.8% |
| Mean | 3.5% | 5.4% |
| Median | 2.6% | 5.0% |
| Interquartile 25% (IQ1) | 1.3% | 4.4% |
| Interquartile 75% (IQ3) | 4.3% | 5.7% |
| Interquartile Range (IQR) | 3.0% | 1.3% |
| Standard Deviation (Sample) | 3.4% | 2.1% |
| Standard Deviation (Population) | 3.3% | 2.0% |
Correlation Details
| Immigrants from Burma/Myanmar Percentile | Sample Size | Unemployment |
[ 0.0% - 0.5% ] 0.038% | 109,816,492 | 5.7% |
[ 0.0% - 0.5% ] 0.12% | 28,045,145 | 4.9% |
[ 0.0% - 0.5% ] 0.22% | 10,630,982 | 4.8% |
[ 0.0% - 0.5% ] 0.30% | 4,426,217 | 5.0% |
[ 0.0% - 0.5% ] 0.38% | 3,394,924 | 4.8% |
[ 0.0% - 0.5% ] 0.48% | 2,424,132 | 5.5% |
[ 0.5% - 1.0% ] 0.58% | 2,458,380 | 5.3% |
[ 0.5% - 1.0% ] 0.65% | 1,513,851 | 4.6% |
[ 0.5% - 1.0% ] 0.73% | 1,356,368 | 5.4% |
[ 0.5% - 1.0% ] 0.84% | 1,123,551 | 5.1% |
[ 0.5% - 1.0% ] 0.92% | 635,789 | 5.3% |
[ 1.0% - 1.5% ] 1.00% | 591,386 | 5.8% |
[ 1.0% - 1.5% ] 1.08% | 1,351,728 | 5.0% |
[ 1.0% - 1.5% ] 1.17% | 423,092 | 4.5% |
[ 1.0% - 1.5% ] 1.26% | 438,016 | 5.0% |
[ 1.0% - 1.5% ] 1.34% | 221,300 | 4.3% |
[ 1.0% - 1.5% ] 1.43% | 406,089 | 4.9% |
[ 1.5% - 2.0% ] 1.51% | 310,391 | 5.0% |
[ 1.5% - 2.0% ] 1.63% | 392,187 | 5.5% |
[ 1.5% - 2.0% ] 1.69% | 182,155 | 5.8% |
[ 1.5% - 2.0% ] 1.79% | 185,148 | 4.6% |
[ 1.5% - 2.0% ] 1.86% | 432,147 | 5.1% |
[ 1.5% - 2.0% ] 1.97% | 19,626 | 4.4% |
[ 2.0% - 2.5% ] 2.06% | 256,522 | 4.3% |
[ 2.0% - 2.5% ] 2.13% | 35,419 | 8.1% |
[ 2.0% - 2.5% ] 2.22% | 55,094 | 4.3% |
[ 2.0% - 2.5% ] 2.29% | 12,778 | 4.1% |
[ 2.0% - 2.5% ] 2.37% | 51,767 | 3.5% |
[ 2.0% - 2.5% ] 2.48% | 133,569 | 5.7% |
[ 2.5% - 3.0% ] 2.55% | 126,252 | 5.2% |
[ 2.5% - 3.0% ] 2.63% | 48,939 | 4.9% |
[ 2.5% - 3.0% ] 2.74% | 85,513 | 5.2% |
[ 2.5% - 3.0% ] 2.81% | 34,537 | 4.2% |
[ 3.0% - 3.5% ] 3.10% | 94,089 | 6.3% |
[ 3.0% - 3.5% ] 3.19% | 24,971 | 6.3% |
[ 3.0% - 3.5% ] 3.27% | 33,912 | 4.9% |
[ 3.0% - 3.5% ] 3.34% | 15,556 | 3.0% |
[ 3.0% - 3.5% ] 3.47% | 58,574 | 5.0% |
[ 3.5% - 4.0% ] 3.53% | 10,424 | 2.7% |
[ 3.5% - 4.0% ] 3.65% | 3,126 | 3.2% |
[ 3.5% - 4.0% ] 3.70% | 23,980 | 5.1% |
[ 3.5% - 4.0% ] 3.81% | 57,662 | 5.7% |
[ 3.5% - 4.0% ] 3.88% | 15,899 | 2.6% |
[ 4.0% - 4.5% ] 4.12% | 25,699 | 6.7% |
[ 4.0% - 4.5% ] 4.21% | 23,879 | 3.8% |
[ 4.0% - 4.5% ] 4.31% | 81,015 | 6.9% |
[ 4.0% - 4.5% ] 4.36% | 2,039 | 5.8% |
[ 4.0% - 4.5% ] 4.48% | 2,029 | 4.2% |
[ 4.5% - 5.0% ] 4.69% | 14,553 | 9.2% |
[ 4.5% - 5.0% ] 4.78% | 2,219 | 11.5% |
[ 5.0% - 5.5% ] 5.11% | 5,268 | 9.0% |
[ 5.0% - 5.5% ] 5.33% | 37,834 | 5.7% |
[ 6.0% - 6.5% ] 6.45% | 19,501 | 6.0% |
[ 6.5% - 7.0% ] 6.88% | 19,613 | 5.1% |
[ 7.5% - 8.0% ] 7.81% | 39,082 | 2.0% |
[ 7.5% - 8.0% ] 7.92% | 56,794 | 2.8% |
[ 8.5% - 9.0% ] 8.70% | 1,035 | 4.1% |
[ 11.0% - 11.5% ] 11.17% | 403 | 11.7% |
[ 12.0% - 12.5% ] 12.20% | 738 | 5.7% |
[ 12.5% - 13.0% ] 12.78% | 266 | 13.8% |
[ 17.0% - 17.5% ] 17.43% | 2,088 | 4.9% |