Immigrants from Burma/Myanmar GED/Equivalency
COMPARE
Immigrants from Burma/Myanmar
Select to Compare
GED/Equivalency
Immigrants from Burma/Myanmar GED/Equivalency
83.0%
GED/EQUIVALENCY
0.2/ 100
METRIC RATING
268th/ 347
METRIC RANK
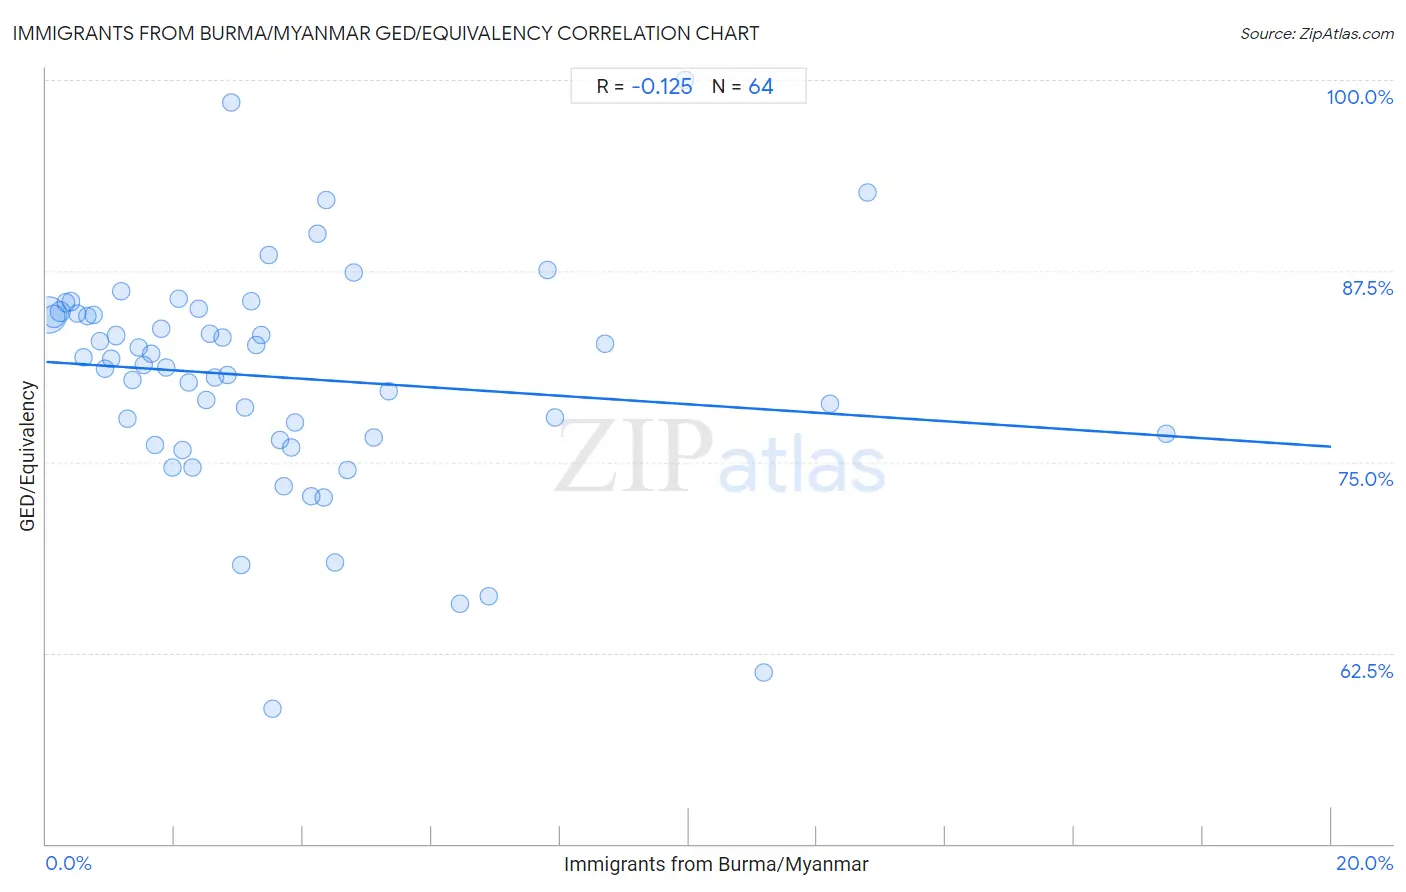
Immigrants from Burma/Myanmar GED/Equivalency Correlation Chart
The statistical analysis conducted on geographies consisting of 172,357,706 people shows a poor negative correlation between the proportion of Immigrants from Burma/Myanmar and percentage of population with at least ged/equivalency education in the United States with a correlation coefficient (R) of -0.125 and weighted average of 83.0%. On average, for every 1% (one percent) increase in Immigrants from Burma/Myanmar within a typical geography, there is a decrease of 0.28% in percentage of population with at least ged/equivalency education.
It is essential to understand that the correlation between the percentage of Immigrants from Burma/Myanmar and percentage of population with at least ged/equivalency education does not imply a direct cause-and-effect relationship. It remains uncertain whether the presence of Immigrants from Burma/Myanmar influences an upward or downward trend in the level of percentage of population with at least ged/equivalency education within an area, or if Immigrants from Burma/Myanmar simply ended up residing in those areas with higher or lower levels of percentage of population with at least ged/equivalency education due to other factors.
Demographics Similar to Immigrants from Burma/Myanmar by GED/Equivalency
In terms of ged/equivalency, the demographic groups most similar to Immigrants from Burma/Myanmar are Trinidadian and Tobagonian (83.0%, a difference of 0.040%), Hopi (83.0%, a difference of 0.040%), West Indian (83.1%, a difference of 0.060%), Kiowa (83.1%, a difference of 0.060%), and Bangladeshi (83.1%, a difference of 0.070%).
| Demographics | Rating | Rank | GED/Equivalency |
| Inupiat | 0.2 /100 | #261 | Tragic 83.1% |
| Immigrants from Armenia | 0.2 /100 | #262 | Tragic 83.1% |
| Immigrants from Congo | 0.2 /100 | #263 | Tragic 83.1% |
| Bangladeshis | 0.2 /100 | #264 | Tragic 83.1% |
| West Indians | 0.2 /100 | #265 | Tragic 83.1% |
| Kiowa | 0.2 /100 | #266 | Tragic 83.1% |
| Trinidadians and Tobagonians | 0.2 /100 | #267 | Tragic 83.0% |
| Immigrants from Burma/Myanmar | 0.2 /100 | #268 | Tragic 83.0% |
| Hopi | 0.2 /100 | #269 | Tragic 83.0% |
| Immigrants from Jamaica | 0.2 /100 | #270 | Tragic 82.9% |
| U.S. Virgin Islanders | 0.2 /100 | #271 | Tragic 82.9% |
| Barbadians | 0.1 /100 | #272 | Tragic 82.9% |
| Pennsylvania Germans | 0.1 /100 | #273 | Tragic 82.9% |
| Immigrants from Trinidad and Tobago | 0.1 /100 | #274 | Tragic 82.8% |
| Seminole | 0.1 /100 | #275 | Tragic 82.8% |
Immigrants from Burma/Myanmar GED/Equivalency Correlation Summary
| Measurement | Immigrants from Burma/Myanmar Data | GED/Equivalency Data |
| Minimum | 0.038% | 58.8% |
| Maximum | 17.4% | 100.0% |
| Range | 17.4% | 41.2% |
| Mean | 3.6% | 80.5% |
| Median | 2.8% | 81.5% |
| Interquartile 25% (IQ1) | 1.4% | 76.5% |
| Interquartile 75% (IQ3) | 4.3% | 84.7% |
| Interquartile Range (IQR) | 3.0% | 8.1% |
| Standard Deviation (Sample) | 3.4% | 7.5% |
| Standard Deviation (Population) | 3.3% | 7.4% |
Correlation Details
| Immigrants from Burma/Myanmar Percentile | Sample Size | GED/Equivalency |
[ 0.0% - 0.5% ] 0.038% | 109,818,160 | 84.6% |
[ 0.0% - 0.5% ] 0.12% | 28,039,544 | 84.5% |
[ 0.0% - 0.5% ] 0.22% | 10,635,484 | 84.8% |
[ 0.0% - 0.5% ] 0.30% | 4,446,590 | 85.4% |
[ 0.0% - 0.5% ] 0.38% | 3,397,342 | 85.5% |
[ 0.0% - 0.5% ] 0.48% | 2,425,227 | 84.7% |
[ 0.5% - 1.0% ] 0.58% | 2,459,066 | 81.9% |
[ 0.5% - 1.0% ] 0.65% | 1,513,851 | 84.5% |
[ 0.5% - 1.0% ] 0.73% | 1,356,368 | 84.6% |
[ 0.5% - 1.0% ] 0.84% | 1,123,551 | 82.9% |
[ 0.5% - 1.0% ] 0.92% | 636,007 | 81.1% |
[ 1.0% - 1.5% ] 1.00% | 594,101 | 81.8% |
[ 1.0% - 1.5% ] 1.08% | 1,357,765 | 83.3% |
[ 1.0% - 1.5% ] 1.17% | 423,092 | 86.2% |
[ 1.0% - 1.5% ] 1.26% | 438,016 | 77.9% |
[ 1.0% - 1.5% ] 1.34% | 223,860 | 80.3% |
[ 1.0% - 1.5% ] 1.43% | 406,228 | 82.5% |
[ 1.5% - 2.0% ] 1.51% | 310,391 | 81.3% |
[ 1.5% - 2.0% ] 1.63% | 392,187 | 82.1% |
[ 1.5% - 2.0% ] 1.69% | 182,155 | 76.1% |
[ 1.5% - 2.0% ] 1.79% | 185,148 | 83.7% |
[ 1.5% - 2.0% ] 1.86% | 432,147 | 81.1% |
[ 1.5% - 2.0% ] 1.97% | 19,626 | 74.6% |
[ 2.0% - 2.5% ] 2.06% | 256,522 | 85.7% |
[ 2.0% - 2.5% ] 2.13% | 35,419 | 75.8% |
[ 2.0% - 2.5% ] 2.22% | 55,094 | 80.2% |
[ 2.0% - 2.5% ] 2.29% | 12,866 | 74.6% |
[ 2.0% - 2.5% ] 2.37% | 52,234 | 85.0% |
[ 2.0% - 2.5% ] 2.48% | 133,569 | 79.1% |
[ 2.5% - 3.0% ] 2.55% | 126,252 | 83.4% |
[ 2.5% - 3.0% ] 2.63% | 48,939 | 80.6% |
[ 2.5% - 3.0% ] 2.74% | 85,513 | 83.2% |
[ 2.5% - 3.0% ] 2.81% | 35,349 | 80.7% |
[ 2.5% - 3.0% ] 2.89% | 1,143 | 98.5% |
[ 3.0% - 3.5% ] 3.03% | 24,684 | 68.3% |
[ 3.0% - 3.5% ] 3.10% | 94,089 | 78.5% |
[ 3.0% - 3.5% ] 3.19% | 24,971 | 85.5% |
[ 3.0% - 3.5% ] 3.27% | 33,912 | 82.7% |
[ 3.0% - 3.5% ] 3.34% | 15,556 | 83.3% |
[ 3.0% - 3.5% ] 3.47% | 58,574 | 88.6% |
[ 3.5% - 4.0% ] 3.53% | 12,010 | 58.8% |
[ 3.5% - 4.0% ] 3.65% | 3,126 | 76.4% |
[ 3.5% - 4.0% ] 3.70% | 23,980 | 73.4% |
[ 3.5% - 4.0% ] 3.81% | 57,662 | 75.9% |
[ 3.5% - 4.0% ] 3.88% | 15,899 | 77.5% |
[ 4.0% - 4.5% ] 4.12% | 25,699 | 72.8% |
[ 4.0% - 4.5% ] 4.21% | 23,879 | 89.9% |
[ 4.0% - 4.5% ] 4.31% | 81,015 | 72.6% |
[ 4.0% - 4.5% ] 4.36% | 2,039 | 92.1% |
[ 4.0% - 4.5% ] 4.48% | 2,029 | 68.4% |
[ 4.5% - 5.0% ] 4.69% | 14,553 | 74.5% |
[ 4.5% - 5.0% ] 4.78% | 2,219 | 87.4% |
[ 5.0% - 5.5% ] 5.11% | 5,268 | 76.6% |
[ 5.0% - 5.5% ] 5.33% | 37,834 | 79.6% |
[ 6.0% - 6.5% ] 6.45% | 19,501 | 65.7% |
[ 6.5% - 7.0% ] 6.88% | 19,613 | 66.2% |
[ 7.5% - 8.0% ] 7.81% | 39,082 | 87.6% |
[ 7.5% - 8.0% ] 7.92% | 56,794 | 77.9% |
[ 8.5% - 9.0% ] 8.70% | 1,035 | 82.8% |
[ 9.5% - 10.0% ] 9.95% | 382 | 100.0% |
[ 11.0% - 11.5% ] 11.17% | 403 | 61.2% |
[ 12.0% - 12.5% ] 12.20% | 738 | 78.8% |
[ 12.5% - 13.0% ] 12.78% | 266 | 92.6% |
[ 17.0% - 17.5% ] 17.43% | 2,088 | 76.9% |