Immigrants from Burma/Myanmar Median Female Earnings
COMPARE
Immigrants from Burma/Myanmar
Select to Compare
Median Female Earnings
Immigrants from Burma/Myanmar Median Female Earnings
$38,028
EARNINGS | FEMALES
3.0/ 100
METRIC RATING
242nd/ 347
METRIC RANK
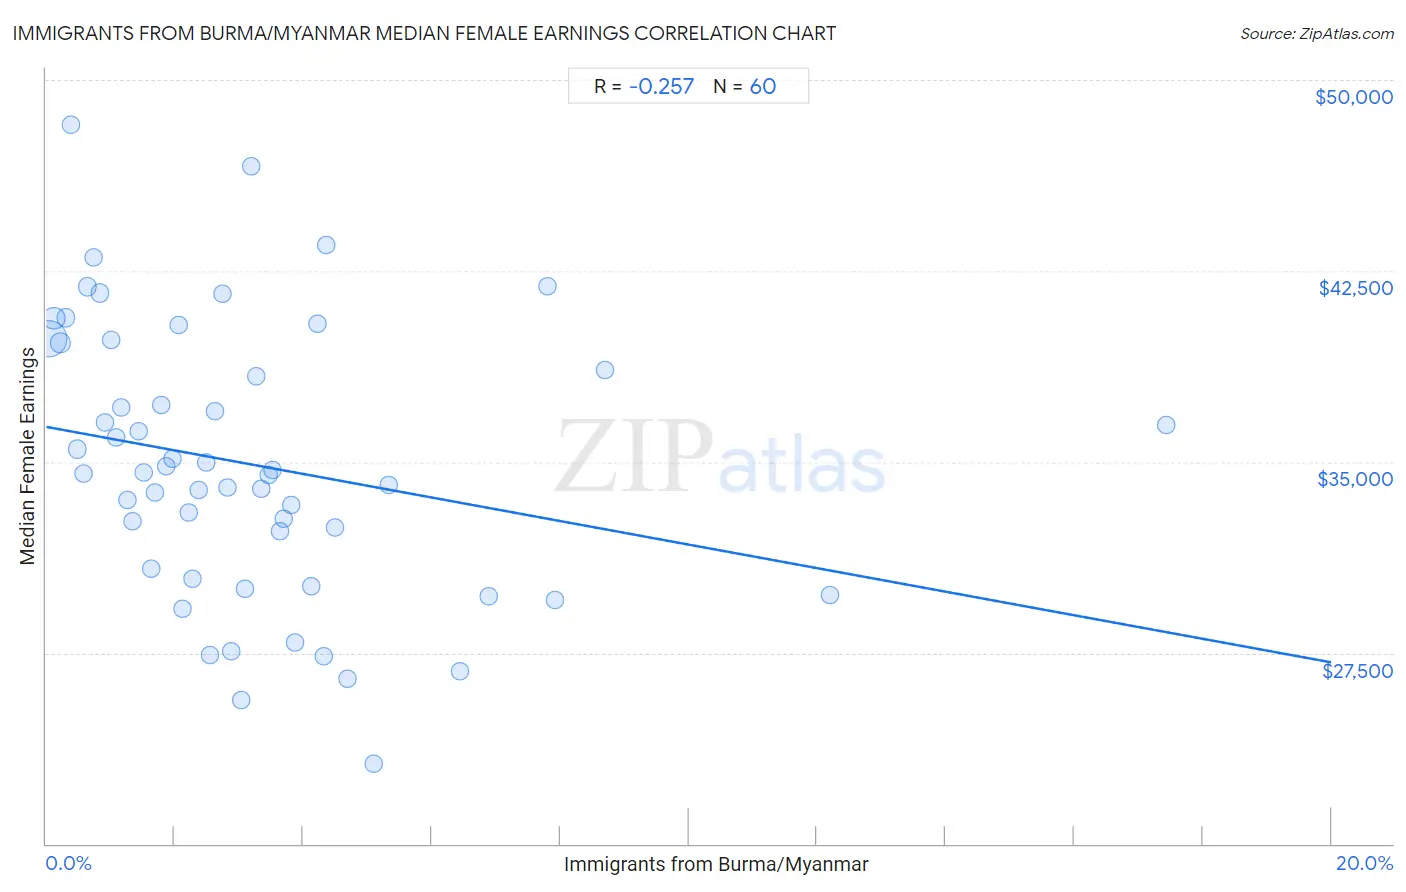
Immigrants from Burma/Myanmar Median Female Earnings Correlation Chart
The statistical analysis conducted on geographies consisting of 172,347,432 people shows a weak negative correlation between the proportion of Immigrants from Burma/Myanmar and median female earnings in the United States with a correlation coefficient (R) of -0.257 and weighted average of $38,028. On average, for every 1% (one percent) increase in Immigrants from Burma/Myanmar within a typical geography, there is a decrease of $463 in median female earnings.
It is essential to understand that the correlation between the percentage of Immigrants from Burma/Myanmar and median female earnings does not imply a direct cause-and-effect relationship. It remains uncertain whether the presence of Immigrants from Burma/Myanmar influences an upward or downward trend in the level of median female earnings within an area, or if Immigrants from Burma/Myanmar simply ended up residing in those areas with higher or lower levels of median female earnings due to other factors.
Demographics Similar to Immigrants from Burma/Myanmar by Median Female Earnings
In terms of median female earnings, the demographic groups most similar to Immigrants from Burma/Myanmar are German ($37,986, a difference of 0.11%), Immigrants from Liberia ($37,970, a difference of 0.15%), Immigrants from Middle Africa ($37,965, a difference of 0.17%), Delaware ($37,964, a difference of 0.17%), and Spanish ($38,098, a difference of 0.18%).
| Demographics | Rating | Rank | Median Female Earnings |
| Sudanese | 4.4 /100 | #235 | Tragic $38,215 |
| Liberians | 4.4 /100 | #236 | Tragic $38,215 |
| Immigrants from Cabo Verde | 4.3 /100 | #237 | Tragic $38,208 |
| Alaska Natives | 4.3 /100 | #238 | Tragic $38,202 |
| English | 4.2 /100 | #239 | Tragic $38,196 |
| Finns | 4.0 /100 | #240 | Tragic $38,173 |
| Spanish | 3.5 /100 | #241 | Tragic $38,098 |
| Immigrants from Burma/Myanmar | 3.0 /100 | #242 | Tragic $38,028 |
| Germans | 2.8 /100 | #243 | Tragic $37,986 |
| Immigrants from Liberia | 2.7 /100 | #244 | Tragic $37,970 |
| Immigrants from Middle Africa | 2.7 /100 | #245 | Tragic $37,965 |
| Delaware | 2.6 /100 | #246 | Tragic $37,964 |
| Immigrants from Somalia | 2.4 /100 | #247 | Tragic $37,914 |
| Alaskan Athabascans | 2.3 /100 | #248 | Tragic $37,905 |
| Swiss | 2.3 /100 | #249 | Tragic $37,904 |
Immigrants from Burma/Myanmar Median Female Earnings Correlation Summary
| Measurement | Immigrants from Burma/Myanmar Data | Median Female Earnings Data |
| Minimum | 0.038% | $23,125 |
| Maximum | 17.4% | $48,239 |
| Range | 17.4% | $25,114 |
| Mean | 3.2% | $34,892 |
| Median | 2.6% | $34,545 |
| Interquartile 25% (IQ1) | 1.3% | $30,606 |
| Interquartile 75% (IQ3) | 4.0% | $39,132 |
| Interquartile Range (IQR) | 2.7% | $8,525 |
| Standard Deviation (Sample) | 3.0% | $5,366 |
| Standard Deviation (Population) | 3.0% | $5,321 |
Correlation Details
| Immigrants from Burma/Myanmar Percentile | Sample Size | Median Female Earnings |
[ 0.0% - 0.5% ] 0.038% | 109,818,160 | $39,814 |
[ 0.0% - 0.5% ] 0.12% | 28,045,145 | $40,646 |
[ 0.0% - 0.5% ] 0.22% | 10,635,484 | $39,669 |
[ 0.0% - 0.5% ] 0.30% | 4,443,055 | $40,663 |
[ 0.0% - 0.5% ] 0.38% | 3,393,849 | $48,239 |
[ 0.0% - 0.5% ] 0.48% | 2,425,227 | $35,503 |
[ 0.5% - 1.0% ] 0.58% | 2,461,502 | $34,527 |
[ 0.5% - 1.0% ] 0.65% | 1,509,983 | $41,880 |
[ 0.5% - 1.0% ] 0.73% | 1,356,368 | $43,023 |
[ 0.5% - 1.0% ] 0.84% | 1,123,551 | $41,635 |
[ 0.5% - 1.0% ] 0.92% | 636,007 | $36,549 |
[ 1.0% - 1.5% ] 1.00% | 594,101 | $39,779 |
[ 1.0% - 1.5% ] 1.08% | 1,356,465 | $35,970 |
[ 1.0% - 1.5% ] 1.17% | 423,092 | $37,149 |
[ 1.0% - 1.5% ] 1.26% | 438,016 | $33,513 |
[ 1.0% - 1.5% ] 1.34% | 223,860 | $32,689 |
[ 1.0% - 1.5% ] 1.43% | 406,228 | $36,204 |
[ 1.5% - 2.0% ] 1.51% | 310,391 | $34,562 |
[ 1.5% - 2.0% ] 1.63% | 391,878 | $30,814 |
[ 1.5% - 2.0% ] 1.69% | 182,155 | $33,782 |
[ 1.5% - 2.0% ] 1.79% | 185,148 | $37,214 |
[ 1.5% - 2.0% ] 1.86% | 432,147 | $34,821 |
[ 1.5% - 2.0% ] 1.97% | 19,626 | $35,139 |
[ 2.0% - 2.5% ] 2.06% | 256,522 | $40,387 |
[ 2.0% - 2.5% ] 2.13% | 35,419 | $29,235 |
[ 2.0% - 2.5% ] 2.22% | 55,094 | $33,011 |
[ 2.0% - 2.5% ] 2.29% | 12,778 | $30,399 |
[ 2.0% - 2.5% ] 2.37% | 52,234 | $33,882 |
[ 2.0% - 2.5% ] 2.48% | 131,759 | $34,960 |
[ 2.5% - 3.0% ] 2.55% | 126,252 | $27,401 |
[ 2.5% - 3.0% ] 2.63% | 48,939 | $36,968 |
[ 2.5% - 3.0% ] 2.74% | 85,513 | $41,600 |
[ 2.5% - 3.0% ] 2.81% | 35,349 | $33,986 |
[ 2.5% - 3.0% ] 2.89% | 1,143 | $27,552 |
[ 3.0% - 3.5% ] 3.03% | 24,684 | $25,625 |
[ 3.0% - 3.5% ] 3.10% | 94,089 | $30,015 |
[ 3.0% - 3.5% ] 3.19% | 24,971 | $46,610 |
[ 3.0% - 3.5% ] 3.27% | 33,912 | $38,368 |
[ 3.0% - 3.5% ] 3.34% | 15,556 | $33,943 |
[ 3.0% - 3.5% ] 3.47% | 57,936 | $34,492 |
[ 3.5% - 4.0% ] 3.53% | 12,010 | $34,676 |
[ 3.5% - 4.0% ] 3.65% | 3,126 | $32,270 |
[ 3.5% - 4.0% ] 3.70% | 23,980 | $32,760 |
[ 3.5% - 4.0% ] 3.81% | 57,662 | $33,287 |
[ 3.5% - 4.0% ] 3.88% | 15,899 | $27,924 |
[ 4.0% - 4.5% ] 4.12% | 25,699 | $30,118 |
[ 4.0% - 4.5% ] 4.21% | 23,879 | $40,429 |
[ 4.0% - 4.5% ] 4.31% | 81,015 | $27,348 |
[ 4.0% - 4.5% ] 4.36% | 2,039 | $43,523 |
[ 4.0% - 4.5% ] 4.48% | 2,029 | $32,417 |
[ 4.5% - 5.0% ] 4.69% | 14,553 | $26,502 |
[ 5.0% - 5.5% ] 5.11% | 5,268 | $23,125 |
[ 5.0% - 5.5% ] 5.33% | 37,834 | $34,087 |
[ 6.0% - 6.5% ] 6.45% | 19,501 | $26,799 |
[ 6.5% - 7.0% ] 6.88% | 19,613 | $29,736 |
[ 7.5% - 8.0% ] 7.81% | 39,082 | $41,877 |
[ 7.5% - 8.0% ] 7.92% | 56,794 | $29,570 |
[ 8.5% - 9.0% ] 8.70% | 1,035 | $38,594 |
[ 12.0% - 12.5% ] 12.20% | 738 | $29,779 |
[ 17.0% - 17.5% ] 17.43% | 2,088 | $36,458 |