Immigrants from Burma/Myanmar Wage/Income Gap
COMPARE
Immigrants from Burma/Myanmar
Select to Compare
Wage/Income Gap
Immigrants from Burma/Myanmar Wage/Income Gap
22.8%
WAGE/INCOME GAP
99.9/ 100
METRIC RATING
74th/ 347
METRIC RANK
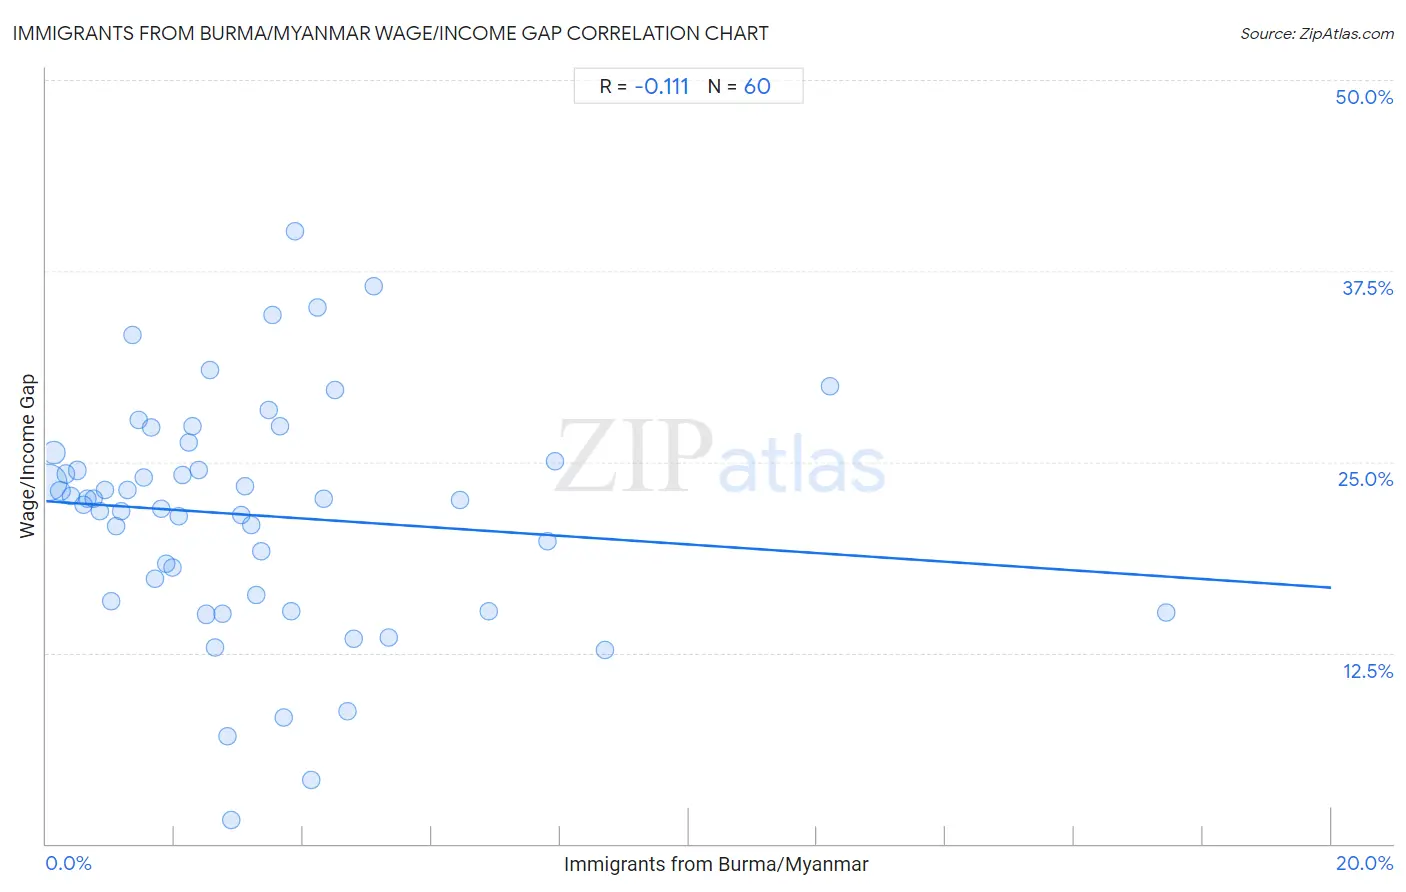
Immigrants from Burma/Myanmar Wage/Income Gap Correlation Chart
The statistical analysis conducted on geographies consisting of 172,335,436 people shows a poor negative correlation between the proportion of Immigrants from Burma/Myanmar and wage/income gap percentage in the United States with a correlation coefficient (R) of -0.111 and weighted average of 22.8%. On average, for every 1% (one percent) increase in Immigrants from Burma/Myanmar within a typical geography, there is a decrease of 0.28% in wage/income gap percentage.
It is essential to understand that the correlation between the percentage of Immigrants from Burma/Myanmar and wage/income gap percentage does not imply a direct cause-and-effect relationship. It remains uncertain whether the presence of Immigrants from Burma/Myanmar influences an upward or downward trend in the level of wage/income gap percentage within an area, or if Immigrants from Burma/Myanmar simply ended up residing in those areas with higher or lower levels of wage/income gap percentage due to other factors.
Demographics Similar to Immigrants from Burma/Myanmar by Wage/Income Gap
In terms of wage/income gap, the demographic groups most similar to Immigrants from Burma/Myanmar are Immigrants from Eastern Africa (22.8%, a difference of 0.080%), Subsaharan African (22.8%, a difference of 0.11%), Immigrants from El Salvador (22.8%, a difference of 0.26%), Fijian (22.9%, a difference of 0.28%), and Ecuadorian (22.9%, a difference of 0.30%).
| Demographics | Rating | Rank | Wage/Income Gap |
| Menominee | 99.9 /100 | #67 | Exceptional 22.7% |
| Immigrants from Nigeria | 99.9 /100 | #68 | Exceptional 22.7% |
| Indonesians | 99.9 /100 | #69 | Exceptional 22.7% |
| Immigrants from Uzbekistan | 99.9 /100 | #70 | Exceptional 22.7% |
| Immigrants from El Salvador | 99.9 /100 | #71 | Exceptional 22.8% |
| Sub-Saharan Africans | 99.9 /100 | #72 | Exceptional 22.8% |
| Immigrants from Eastern Africa | 99.9 /100 | #73 | Exceptional 22.8% |
| Immigrants from Burma/Myanmar | 99.9 /100 | #74 | Exceptional 22.8% |
| Fijians | 99.9 /100 | #75 | Exceptional 22.9% |
| Ecuadorians | 99.9 /100 | #76 | Exceptional 22.9% |
| Africans | 99.9 /100 | #77 | Exceptional 22.9% |
| Nigerians | 99.9 /100 | #78 | Exceptional 23.0% |
| Immigrants from Nicaragua | 99.9 /100 | #79 | Exceptional 23.0% |
| Salvadorans | 99.9 /100 | #80 | Exceptional 23.0% |
| Bermudans | 99.8 /100 | #81 | Exceptional 23.1% |
Immigrants from Burma/Myanmar Wage/Income Gap Correlation Summary
| Measurement | Immigrants from Burma/Myanmar Data | Wage/Income Gap Data |
| Minimum | 0.038% | 1.6% |
| Maximum | 17.4% | 40.1% |
| Range | 17.4% | 38.6% |
| Mean | 3.2% | 21.5% |
| Median | 2.6% | 22.5% |
| Interquartile 25% (IQ1) | 1.3% | 16.1% |
| Interquartile 75% (IQ3) | 4.0% | 25.3% |
| Interquartile Range (IQR) | 2.7% | 9.2% |
| Standard Deviation (Sample) | 3.0% | 7.6% |
| Standard Deviation (Population) | 3.0% | 7.6% |
Correlation Details
| Immigrants from Burma/Myanmar Percentile | Sample Size | Wage/Income Gap |
[ 0.0% - 0.5% ] 0.038% | 109,818,160 | 23.6% |
[ 0.0% - 0.5% ] 0.12% | 28,045,145 | 25.6% |
[ 0.0% - 0.5% ] 0.22% | 10,631,320 | 23.1% |
[ 0.0% - 0.5% ] 0.30% | 4,443,055 | 24.2% |
[ 0.0% - 0.5% ] 0.38% | 3,393,849 | 22.7% |
[ 0.0% - 0.5% ] 0.48% | 2,425,227 | 24.4% |
[ 0.5% - 1.0% ] 0.58% | 2,458,383 | 22.2% |
[ 0.5% - 1.0% ] 0.65% | 1,509,983 | 22.6% |
[ 0.5% - 1.0% ] 0.73% | 1,356,368 | 22.6% |
[ 0.5% - 1.0% ] 0.84% | 1,123,551 | 21.8% |
[ 0.5% - 1.0% ] 0.92% | 636,007 | 23.1% |
[ 1.0% - 1.5% ] 1.00% | 594,101 | 15.9% |
[ 1.0% - 1.5% ] 1.08% | 1,356,465 | 20.8% |
[ 1.0% - 1.5% ] 1.17% | 423,092 | 21.7% |
[ 1.0% - 1.5% ] 1.26% | 438,016 | 23.2% |
[ 1.0% - 1.5% ] 1.34% | 223,860 | 33.3% |
[ 1.0% - 1.5% ] 1.43% | 406,228 | 27.7% |
[ 1.5% - 2.0% ] 1.51% | 310,391 | 24.0% |
[ 1.5% - 2.0% ] 1.63% | 391,878 | 27.2% |
[ 1.5% - 2.0% ] 1.69% | 182,155 | 17.3% |
[ 1.5% - 2.0% ] 1.79% | 185,148 | 21.9% |
[ 1.5% - 2.0% ] 1.86% | 432,147 | 18.4% |
[ 1.5% - 2.0% ] 1.97% | 19,626 | 18.1% |
[ 2.0% - 2.5% ] 2.06% | 256,522 | 21.4% |
[ 2.0% - 2.5% ] 2.13% | 35,419 | 24.1% |
[ 2.0% - 2.5% ] 2.22% | 53,324 | 26.3% |
[ 2.0% - 2.5% ] 2.29% | 12,778 | 27.3% |
[ 2.0% - 2.5% ] 2.37% | 51,767 | 24.5% |
[ 2.0% - 2.5% ] 2.48% | 131,759 | 15.0% |
[ 2.5% - 3.0% ] 2.55% | 126,252 | 31.0% |
[ 2.5% - 3.0% ] 2.63% | 48,939 | 12.9% |
[ 2.5% - 3.0% ] 2.74% | 85,513 | 15.0% |
[ 2.5% - 3.0% ] 2.81% | 34,279 | 7.0% |
[ 2.5% - 3.0% ] 2.89% | 1,143 | 1.6% |
[ 3.0% - 3.5% ] 3.03% | 24,684 | 21.5% |
[ 3.0% - 3.5% ] 3.10% | 94,089 | 23.4% |
[ 3.0% - 3.5% ] 3.19% | 24,971 | 20.8% |
[ 3.0% - 3.5% ] 3.27% | 33,912 | 16.3% |
[ 3.0% - 3.5% ] 3.34% | 15,556 | 19.2% |
[ 3.0% - 3.5% ] 3.47% | 57,936 | 28.4% |
[ 3.5% - 4.0% ] 3.53% | 10,424 | 34.6% |
[ 3.5% - 4.0% ] 3.65% | 3,126 | 27.4% |
[ 3.5% - 4.0% ] 3.70% | 23,980 | 8.3% |
[ 3.5% - 4.0% ] 3.81% | 57,662 | 15.2% |
[ 3.5% - 4.0% ] 3.88% | 15,899 | 40.1% |
[ 4.0% - 4.5% ] 4.12% | 25,699 | 4.2% |
[ 4.0% - 4.5% ] 4.21% | 23,879 | 35.1% |
[ 4.0% - 4.5% ] 4.31% | 81,015 | 22.6% |
[ 4.0% - 4.5% ] 4.48% | 2,029 | 29.7% |
[ 4.5% - 5.0% ] 4.69% | 14,553 | 8.7% |
[ 4.5% - 5.0% ] 4.78% | 2,219 | 13.4% |
[ 5.0% - 5.5% ] 5.11% | 5,268 | 36.5% |
[ 5.0% - 5.5% ] 5.33% | 37,834 | 13.5% |
[ 6.0% - 6.5% ] 6.45% | 19,501 | 22.5% |
[ 6.5% - 7.0% ] 6.88% | 19,613 | 15.2% |
[ 7.5% - 8.0% ] 7.81% | 39,082 | 19.8% |
[ 7.5% - 8.0% ] 7.92% | 56,794 | 25.1% |
[ 8.5% - 9.0% ] 8.70% | 1,035 | 12.7% |
[ 12.0% - 12.5% ] 12.20% | 738 | 29.9% |
[ 17.0% - 17.5% ] 17.43% | 2,088 | 15.2% |