Immigrants from Burma/Myanmar No Schooling Completed
COMPARE
Immigrants from Burma/Myanmar
Select to Compare
No Schooling Completed
Immigrants from Burma/Myanmar No Schooling Completed
3.1%
NO SCHOOLING
0.0/ 100
METRIC RATING
319th/ 347
METRIC RANK
Immigrants from Burma/Myanmar No Schooling Completed Correlation Chart
The statistical analysis conducted on geographies consisting of 171,802,703 people shows a poor positive correlation between the proportion of Immigrants from Burma/Myanmar and percentage of population with no schooling in the United States with a correlation coefficient (R) of 0.188 and weighted average of 3.1%. On average, for every 1% (one percent) increase in Immigrants from Burma/Myanmar within a typical geography, there is an increase of 0.13% in percentage of population with no schooling.
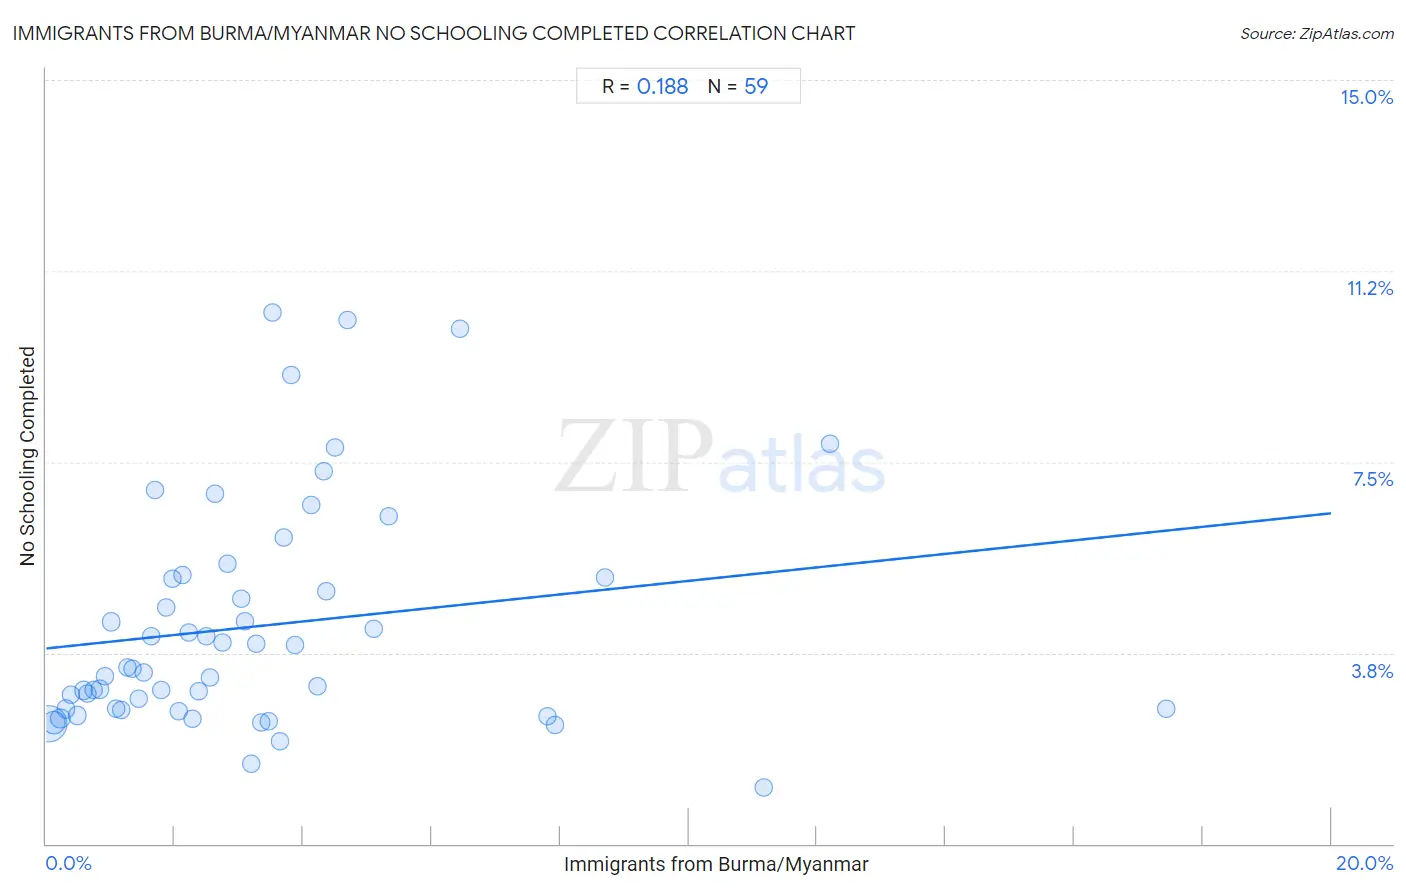
It is essential to understand that the correlation between the percentage of Immigrants from Burma/Myanmar and percentage of population with no schooling does not imply a direct cause-and-effect relationship. It remains uncertain whether the presence of Immigrants from Burma/Myanmar influences an upward or downward trend in the level of percentage of population with no schooling within an area, or if Immigrants from Burma/Myanmar simply ended up residing in those areas with higher or lower levels of percentage of population with no schooling due to other factors.
Demographics Similar to Immigrants from Burma/Myanmar by No Schooling Completed
In terms of no schooling completed, the demographic groups most similar to Immigrants from Burma/Myanmar are Immigrants from Bangladesh (3.1%, a difference of 0.040%), Immigrants from Laos (3.1%, a difference of 0.15%), Immigrants from Guyana (3.1%, a difference of 0.74%), Immigrants from Honduras (3.2%, a difference of 0.83%), and Vietnamese (3.2%, a difference of 1.0%).
| Demographics | Rating | Rank | No Schooling Completed |
| Sri Lankans | 0.0 /100 | #312 | Tragic 3.0% |
| Hondurans | 0.0 /100 | #313 | Tragic 3.1% |
| Immigrants from Belize | 0.0 /100 | #314 | Tragic 3.1% |
| Immigrants from Nicaragua | 0.0 /100 | #315 | Tragic 3.1% |
| Immigrants from Ecuador | 0.0 /100 | #316 | Tragic 3.1% |
| Cape Verdeans | 0.0 /100 | #317 | Tragic 3.1% |
| Immigrants from Guyana | 0.0 /100 | #318 | Tragic 3.1% |
| Immigrants from Burma/Myanmar | 0.0 /100 | #319 | Tragic 3.1% |
| Immigrants from Bangladesh | 0.0 /100 | #320 | Tragic 3.1% |
| Immigrants from Laos | 0.0 /100 | #321 | Tragic 3.1% |
| Immigrants from Honduras | 0.0 /100 | #322 | Tragic 3.2% |
| Vietnamese | 0.0 /100 | #323 | Tragic 3.2% |
| Mexican American Indians | 0.0 /100 | #324 | Tragic 3.2% |
| Dominicans | 0.0 /100 | #325 | Tragic 3.2% |
| Indonesians | 0.0 /100 | #326 | Tragic 3.2% |
Immigrants from Burma/Myanmar No Schooling Completed Correlation Summary
| Measurement | Immigrants from Burma/Myanmar Data | No Schooling Completed Data |
| Minimum | 0.038% | 1.1% |
| Maximum | 17.4% | 10.4% |
| Range | 17.4% | 9.3% |
| Mean | 3.3% | 4.3% |
| Median | 2.6% | 3.4% |
| Interquartile 25% (IQ1) | 1.3% | 2.6% |
| Interquartile 75% (IQ3) | 4.1% | 5.2% |
| Interquartile Range (IQR) | 2.9% | 2.6% |
| Standard Deviation (Sample) | 3.1% | 2.2% |
| Standard Deviation (Population) | 3.1% | 2.2% |
Correlation Details
| Immigrants from Burma/Myanmar Percentile | Sample Size | No Schooling Completed |
[ 0.0% - 0.5% ] 0.038% | 109,687,728 | 2.3% |
[ 0.0% - 0.5% ] 0.12% | 27,929,702 | 2.4% |
[ 0.0% - 0.5% ] 0.22% | 10,584,293 | 2.5% |
[ 0.0% - 0.5% ] 0.30% | 4,350,424 | 2.6% |
[ 0.0% - 0.5% ] 0.38% | 3,357,707 | 2.9% |
[ 0.0% - 0.5% ] 0.48% | 2,395,042 | 2.5% |
[ 0.5% - 1.0% ] 0.58% | 2,451,194 | 3.0% |
[ 0.5% - 1.0% ] 0.65% | 1,504,223 | 2.9% |
[ 0.5% - 1.0% ] 0.73% | 1,346,122 | 3.0% |
[ 0.5% - 1.0% ] 0.84% | 1,123,551 | 3.0% |
[ 0.5% - 1.0% ] 0.92% | 636,007 | 3.3% |
[ 1.0% - 1.5% ] 1.00% | 581,724 | 4.4% |
[ 1.0% - 1.5% ] 1.08% | 1,356,643 | 2.6% |
[ 1.0% - 1.5% ] 1.17% | 419,756 | 2.6% |
[ 1.0% - 1.5% ] 1.26% | 438,016 | 3.5% |
[ 1.0% - 1.5% ] 1.34% | 209,190 | 3.4% |
[ 1.0% - 1.5% ] 1.43% | 406,228 | 2.8% |
[ 1.5% - 2.0% ] 1.51% | 307,176 | 3.4% |
[ 1.5% - 2.0% ] 1.63% | 391,878 | 4.1% |
[ 1.5% - 2.0% ] 1.69% | 178,707 | 6.9% |
[ 1.5% - 2.0% ] 1.79% | 185,148 | 3.0% |
[ 1.5% - 2.0% ] 1.86% | 432,147 | 4.6% |
[ 1.5% - 2.0% ] 1.97% | 19,626 | 5.2% |
[ 2.0% - 2.5% ] 2.06% | 256,522 | 2.6% |
[ 2.0% - 2.5% ] 2.13% | 35,419 | 5.3% |
[ 2.0% - 2.5% ] 2.22% | 53,324 | 4.2% |
[ 2.0% - 2.5% ] 2.29% | 12,866 | 2.5% |
[ 2.0% - 2.5% ] 2.37% | 51,767 | 3.0% |
[ 2.0% - 2.5% ] 2.48% | 132,627 | 4.1% |
[ 2.5% - 3.0% ] 2.55% | 122,537 | 3.3% |
[ 2.5% - 3.0% ] 2.63% | 48,939 | 6.9% |
[ 2.5% - 3.0% ] 2.74% | 85,513 | 3.9% |
[ 2.5% - 3.0% ] 2.81% | 34,537 | 5.5% |
[ 3.0% - 3.5% ] 3.03% | 24,684 | 4.8% |
[ 3.0% - 3.5% ] 3.10% | 94,089 | 4.4% |
[ 3.0% - 3.5% ] 3.19% | 24,971 | 1.6% |
[ 3.0% - 3.5% ] 3.27% | 33,912 | 3.9% |
[ 3.0% - 3.5% ] 3.34% | 15,556 | 2.4% |
[ 3.0% - 3.5% ] 3.47% | 58,574 | 2.4% |
[ 3.5% - 4.0% ] 3.53% | 12,010 | 10.4% |
[ 3.5% - 4.0% ] 3.65% | 3,126 | 2.0% |
[ 3.5% - 4.0% ] 3.70% | 23,980 | 6.0% |
[ 3.5% - 4.0% ] 3.81% | 57,662 | 9.2% |
[ 3.5% - 4.0% ] 3.88% | 15,899 | 3.9% |
[ 4.0% - 4.5% ] 4.12% | 25,699 | 6.7% |
[ 4.0% - 4.5% ] 4.21% | 23,879 | 3.1% |
[ 4.0% - 4.5% ] 4.31% | 81,015 | 7.3% |
[ 4.0% - 4.5% ] 4.36% | 2,039 | 5.0% |
[ 4.0% - 4.5% ] 4.48% | 2,029 | 7.8% |
[ 4.5% - 5.0% ] 4.69% | 14,553 | 10.3% |
[ 5.0% - 5.5% ] 5.11% | 5,268 | 4.2% |
[ 5.0% - 5.5% ] 5.33% | 37,834 | 6.4% |
[ 6.0% - 6.5% ] 6.45% | 19,501 | 10.1% |
[ 7.5% - 8.0% ] 7.81% | 39,082 | 2.5% |
[ 7.5% - 8.0% ] 7.92% | 56,794 | 2.3% |
[ 8.5% - 9.0% ] 8.70% | 1,035 | 5.2% |
[ 11.0% - 11.5% ] 11.17% | 403 | 1.1% |
[ 12.0% - 12.5% ] 12.20% | 738 | 7.9% |
[ 17.0% - 17.5% ] 17.43% | 2,088 | 2.7% |