Immigrants from Burma/Myanmar Single Father Households
COMPARE
Immigrants from Burma/Myanmar
Select to Compare
Single Father Households
Immigrants from Burma/Myanmar Single Father Households
2.4%
SINGLE FATHER HOUSEHOLDS
12.1/ 100
METRIC RATING
221st/ 347
METRIC RANK
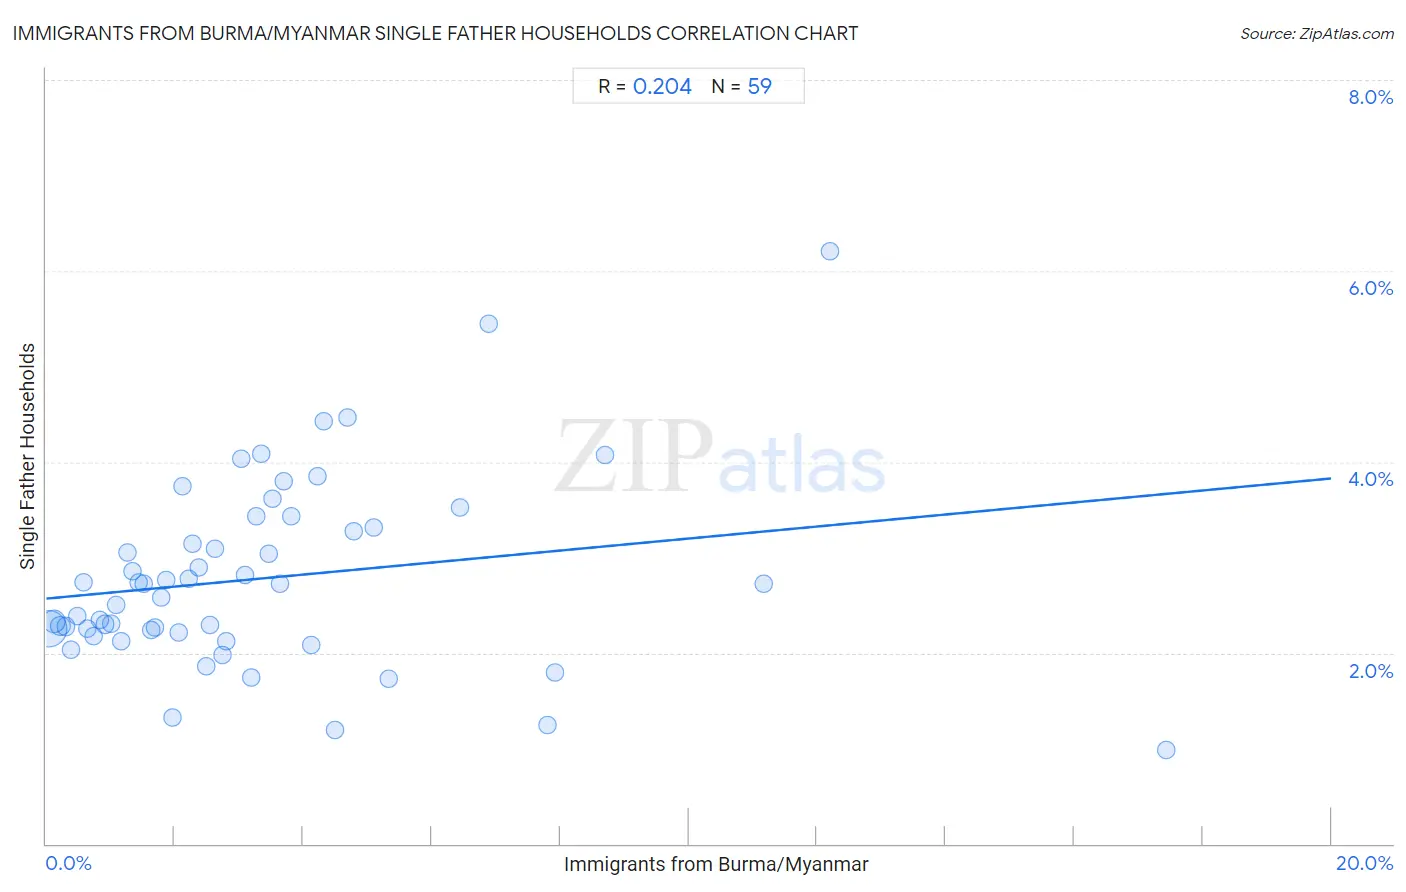
Immigrants from Burma/Myanmar Single Father Households Correlation Chart
The statistical analysis conducted on geographies consisting of 171,785,459 people shows a weak positive correlation between the proportion of Immigrants from Burma/Myanmar and percentage of single father households in the United States with a correlation coefficient (R) of 0.204 and weighted average of 2.4%. On average, for every 1% (one percent) increase in Immigrants from Burma/Myanmar within a typical geography, there is an increase of 0.063% in percentage of single father households.
It is essential to understand that the correlation between the percentage of Immigrants from Burma/Myanmar and percentage of single father households does not imply a direct cause-and-effect relationship. It remains uncertain whether the presence of Immigrants from Burma/Myanmar influences an upward or downward trend in the level of percentage of single father households within an area, or if Immigrants from Burma/Myanmar simply ended up residing in those areas with higher or lower levels of percentage of single father households due to other factors.
Demographics Similar to Immigrants from Burma/Myanmar by Single Father Households
In terms of single father households, the demographic groups most similar to Immigrants from Burma/Myanmar are Immigrants from Eastern Africa (2.4%, a difference of 0.030%), Ghanaian (2.4%, a difference of 0.13%), Sudanese (2.4%, a difference of 0.14%), Immigrants from Uruguay (2.4%, a difference of 0.19%), and Immigrants from Ethiopia (2.4%, a difference of 0.21%).
| Demographics | Rating | Rank | Single Father Households |
| Ethiopians | 16.6 /100 | #214 | Poor 2.4% |
| Immigrants from South Eastern Asia | 15.9 /100 | #215 | Poor 2.4% |
| Immigrants from Ecuador | 14.9 /100 | #216 | Poor 2.4% |
| Dutch | 14.3 /100 | #217 | Poor 2.4% |
| Immigrants from Ethiopia | 13.4 /100 | #218 | Poor 2.4% |
| Sudanese | 13.0 /100 | #219 | Poor 2.4% |
| Ghanaians | 12.9 /100 | #220 | Poor 2.4% |
| Immigrants from Burma/Myanmar | 12.1 /100 | #221 | Poor 2.4% |
| Immigrants from Eastern Africa | 11.9 /100 | #222 | Poor 2.4% |
| Immigrants from Uruguay | 11.0 /100 | #223 | Poor 2.4% |
| Immigrants from Bahamas | 10.6 /100 | #224 | Poor 2.4% |
| Marshallese | 9.7 /100 | #225 | Tragic 2.4% |
| Blacks/African Americans | 9.7 /100 | #226 | Tragic 2.4% |
| Americans | 9.3 /100 | #227 | Tragic 2.4% |
| Immigrants from Ghana | 9.1 /100 | #228 | Tragic 2.4% |
Immigrants from Burma/Myanmar Single Father Households Correlation Summary
| Measurement | Immigrants from Burma/Myanmar Data | Single Father Households Data |
| Minimum | 0.038% | 0.98% |
| Maximum | 17.4% | 6.2% |
| Range | 17.4% | 5.2% |
| Mean | 3.3% | 2.8% |
| Median | 2.6% | 2.7% |
| Interquartile 25% (IQ1) | 1.3% | 2.2% |
| Interquartile 75% (IQ3) | 4.2% | 3.3% |
| Interquartile Range (IQR) | 3.0% | 1.1% |
| Standard Deviation (Sample) | 3.2% | 0.98% |
| Standard Deviation (Population) | 3.2% | 0.97% |
Correlation Details
| Immigrants from Burma/Myanmar Percentile | Sample Size | Single Father Households |
[ 0.0% - 0.5% ] 0.038% | 109,618,111 | 2.2% |
[ 0.0% - 0.5% ] 0.12% | 27,898,806 | 2.3% |
[ 0.0% - 0.5% ] 0.22% | 10,573,195 | 2.3% |
[ 0.0% - 0.5% ] 0.30% | 4,401,777 | 2.3% |
[ 0.0% - 0.5% ] 0.38% | 3,387,796 | 2.0% |
[ 0.0% - 0.5% ] 0.48% | 2,395,762 | 2.4% |
[ 0.5% - 1.0% ] 0.58% | 2,457,320 | 2.7% |
[ 0.5% - 1.0% ] 0.65% | 1,512,882 | 2.3% |
[ 0.5% - 1.0% ] 0.73% | 1,356,368 | 2.2% |
[ 0.5% - 1.0% ] 0.84% | 1,123,551 | 2.3% |
[ 0.5% - 1.0% ] 0.92% | 635,789 | 2.3% |
[ 1.0% - 1.5% ] 1.00% | 572,943 | 2.3% |
[ 1.0% - 1.5% ] 1.08% | 1,350,740 | 2.5% |
[ 1.0% - 1.5% ] 1.17% | 419,756 | 2.1% |
[ 1.0% - 1.5% ] 1.26% | 430,230 | 3.1% |
[ 1.0% - 1.5% ] 1.34% | 221,300 | 2.9% |
[ 1.0% - 1.5% ] 1.43% | 403,554 | 2.7% |
[ 1.5% - 2.0% ] 1.51% | 310,391 | 2.7% |
[ 1.5% - 2.0% ] 1.63% | 384,890 | 2.2% |
[ 1.5% - 2.0% ] 1.69% | 182,155 | 2.3% |
[ 1.5% - 2.0% ] 1.79% | 185,148 | 2.6% |
[ 1.5% - 2.0% ] 1.86% | 432,147 | 2.8% |
[ 1.5% - 2.0% ] 1.97% | 19,626 | 1.3% |
[ 2.0% - 2.5% ] 2.06% | 256,522 | 2.2% |
[ 2.0% - 2.5% ] 2.13% | 35,419 | 3.7% |
[ 2.0% - 2.5% ] 2.22% | 49,885 | 2.8% |
[ 2.0% - 2.5% ] 2.29% | 12,866 | 3.1% |
[ 2.0% - 2.5% ] 2.37% | 51,767 | 2.9% |
[ 2.0% - 2.5% ] 2.48% | 132,627 | 1.9% |
[ 2.5% - 3.0% ] 2.55% | 126,252 | 2.3% |
[ 2.5% - 3.0% ] 2.63% | 48,939 | 3.1% |
[ 2.5% - 3.0% ] 2.74% | 85,513 | 2.0% |
[ 2.5% - 3.0% ] 2.81% | 32,704 | 2.1% |
[ 3.0% - 3.5% ] 3.03% | 24,684 | 4.0% |
[ 3.0% - 3.5% ] 3.10% | 94,089 | 2.8% |
[ 3.0% - 3.5% ] 3.19% | 24,971 | 1.7% |
[ 3.0% - 3.5% ] 3.27% | 33,912 | 3.4% |
[ 3.0% - 3.5% ] 3.34% | 15,556 | 4.1% |
[ 3.0% - 3.5% ] 3.47% | 58,574 | 3.0% |
[ 3.5% - 4.0% ] 3.53% | 10,424 | 3.6% |
[ 3.5% - 4.0% ] 3.65% | 3,126 | 2.7% |
[ 3.5% - 4.0% ] 3.70% | 23,980 | 3.8% |
[ 3.5% - 4.0% ] 3.81% | 57,662 | 3.4% |
[ 4.0% - 4.5% ] 4.12% | 25,699 | 2.1% |
[ 4.0% - 4.5% ] 4.21% | 23,879 | 3.8% |
[ 4.0% - 4.5% ] 4.31% | 81,015 | 4.4% |
[ 4.0% - 4.5% ] 4.48% | 2,029 | 1.2% |
[ 4.5% - 5.0% ] 4.69% | 14,553 | 4.5% |
[ 4.5% - 5.0% ] 4.78% | 2,219 | 3.3% |
[ 5.0% - 5.5% ] 5.11% | 5,268 | 3.3% |
[ 5.0% - 5.5% ] 5.33% | 37,834 | 1.7% |
[ 6.0% - 6.5% ] 6.45% | 19,501 | 3.5% |
[ 6.5% - 7.0% ] 6.88% | 19,613 | 5.4% |
[ 7.5% - 8.0% ] 7.81% | 39,082 | 1.2% |
[ 7.5% - 8.0% ] 7.92% | 56,794 | 1.8% |
[ 8.5% - 9.0% ] 8.70% | 1,035 | 4.1% |
[ 11.0% - 11.5% ] 11.17% | 403 | 2.7% |
[ 12.0% - 12.5% ] 12.20% | 738 | 6.2% |
[ 17.0% - 17.5% ] 17.43% | 2,088 | 0.98% |