Immigrants from Burma/Myanmar Female Unemployment
COMPARE
Immigrants from Burma/Myanmar
Select to Compare
Female Unemployment
Immigrants from Burma/Myanmar Female Unemployment
5.1%
UNEMPLOYMENT | FEMALES
92.3/ 100
METRIC RATING
111th/ 347
METRIC RANK
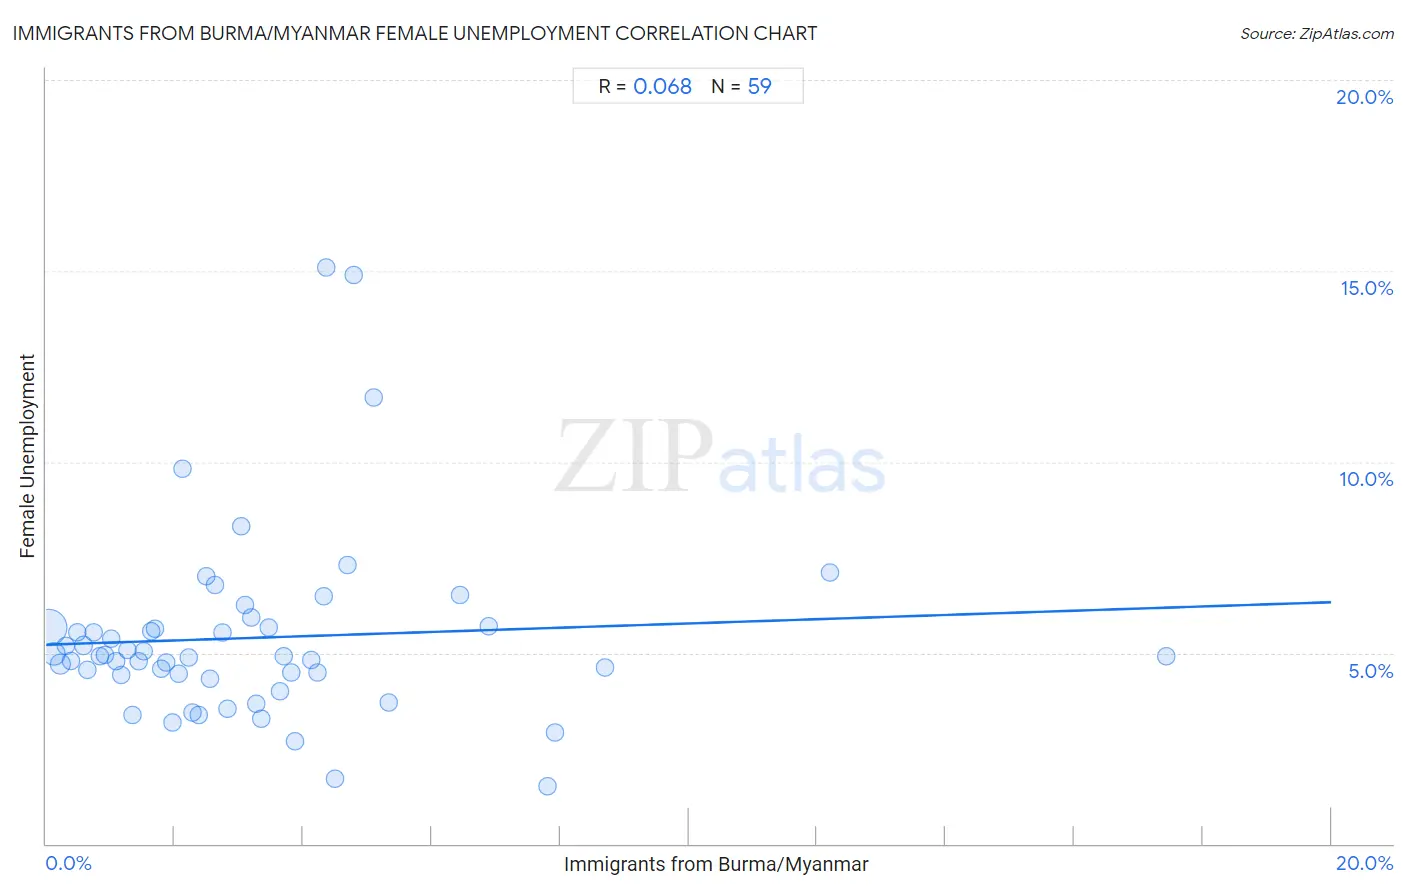
Immigrants from Burma/Myanmar Female Unemployment Correlation Chart
The statistical analysis conducted on geographies consisting of 172,103,877 people shows a slight positive correlation between the proportion of Immigrants from Burma/Myanmar and unemploymnet rate among females in the United States with a correlation coefficient (R) of 0.068 and weighted average of 5.1%. On average, for every 1% (one percent) increase in Immigrants from Burma/Myanmar within a typical geography, there is an increase of 0.056% in unemploymnet rate among females.
It is essential to understand that the correlation between the percentage of Immigrants from Burma/Myanmar and unemploymnet rate among females does not imply a direct cause-and-effect relationship. It remains uncertain whether the presence of Immigrants from Burma/Myanmar influences an upward or downward trend in the level of unemploymnet rate among females within an area, or if Immigrants from Burma/Myanmar simply ended up residing in those areas with higher or lower levels of unemploymnet rate among females due to other factors.
Demographics Similar to Immigrants from Burma/Myanmar by Female Unemployment
In terms of female unemployment, the demographic groups most similar to Immigrants from Burma/Myanmar are Macedonian (5.1%, a difference of 0.030%), Estonian (5.1%, a difference of 0.030%), Immigrants from Eastern Africa (5.1%, a difference of 0.13%), Puget Sound Salish (5.1%, a difference of 0.17%), and Immigrants from Switzerland (5.1%, a difference of 0.20%).
| Demographics | Rating | Rank | Female Unemployment |
| Kenyans | 93.7 /100 | #104 | Exceptional 5.0% |
| Immigrants from England | 93.6 /100 | #105 | Exceptional 5.0% |
| Paraguayans | 93.2 /100 | #106 | Exceptional 5.1% |
| Immigrants from Switzerland | 93.1 /100 | #107 | Exceptional 5.1% |
| Puget Sound Salish | 93.0 /100 | #108 | Exceptional 5.1% |
| Immigrants from Eastern Africa | 92.8 /100 | #109 | Exceptional 5.1% |
| Macedonians | 92.4 /100 | #110 | Exceptional 5.1% |
| Immigrants from Burma/Myanmar | 92.3 /100 | #111 | Exceptional 5.1% |
| Estonians | 92.1 /100 | #112 | Exceptional 5.1% |
| Immigrants from Saudi Arabia | 91.2 /100 | #113 | Exceptional 5.1% |
| Immigrants from Turkey | 91.0 /100 | #114 | Exceptional 5.1% |
| Lebanese | 91.0 /100 | #115 | Exceptional 5.1% |
| Americans | 90.5 /100 | #116 | Exceptional 5.1% |
| Jordanians | 90.3 /100 | #117 | Exceptional 5.1% |
| Immigrants from Croatia | 89.9 /100 | #118 | Excellent 5.1% |
Immigrants from Burma/Myanmar Female Unemployment Correlation Summary
| Measurement | Immigrants from Burma/Myanmar Data | Female Unemployment Data |
| Minimum | 0.038% | 1.5% |
| Maximum | 17.4% | 15.1% |
| Range | 17.4% | 13.6% |
| Mean | 3.2% | 5.4% |
| Median | 2.6% | 4.9% |
| Interquartile 25% (IQ1) | 1.3% | 4.4% |
| Interquartile 75% (IQ3) | 4.2% | 5.7% |
| Interquartile Range (IQR) | 3.0% | 1.3% |
| Standard Deviation (Sample) | 3.0% | 2.5% |
| Standard Deviation (Population) | 3.0% | 2.4% |
Correlation Details
| Immigrants from Burma/Myanmar Percentile | Sample Size | Female Unemployment |
[ 0.0% - 0.5% ] 0.038% | 109,798,929 | 5.7% |
[ 0.0% - 0.5% ] 0.12% | 27,997,315 | 5.0% |
[ 0.0% - 0.5% ] 0.22% | 10,587,742 | 4.7% |
[ 0.0% - 0.5% ] 0.30% | 4,410,860 | 5.2% |
[ 0.0% - 0.5% ] 0.38% | 3,378,359 | 4.8% |
[ 0.0% - 0.5% ] 0.48% | 2,418,586 | 5.5% |
[ 0.5% - 1.0% ] 0.58% | 2,444,749 | 5.2% |
[ 0.5% - 1.0% ] 0.65% | 1,503,214 | 4.5% |
[ 0.5% - 1.0% ] 0.73% | 1,354,892 | 5.5% |
[ 0.5% - 1.0% ] 0.84% | 1,121,736 | 4.9% |
[ 0.5% - 1.0% ] 0.92% | 630,445 | 4.9% |
[ 1.0% - 1.5% ] 1.00% | 590,672 | 5.4% |
[ 1.0% - 1.5% ] 1.08% | 1,350,606 | 4.8% |
[ 1.0% - 1.5% ] 1.17% | 423,092 | 4.4% |
[ 1.0% - 1.5% ] 1.26% | 437,282 | 5.1% |
[ 1.0% - 1.5% ] 1.34% | 221,300 | 3.4% |
[ 1.0% - 1.5% ] 1.43% | 395,437 | 4.8% |
[ 1.5% - 2.0% ] 1.51% | 309,014 | 5.0% |
[ 1.5% - 2.0% ] 1.63% | 392,187 | 5.6% |
[ 1.5% - 2.0% ] 1.69% | 178,707 | 5.6% |
[ 1.5% - 2.0% ] 1.79% | 185,148 | 4.6% |
[ 1.5% - 2.0% ] 1.86% | 432,147 | 4.7% |
[ 1.5% - 2.0% ] 1.97% | 19,626 | 3.2% |
[ 2.0% - 2.5% ] 2.06% | 256,522 | 4.5% |
[ 2.0% - 2.5% ] 2.13% | 34,455 | 9.8% |
[ 2.0% - 2.5% ] 2.22% | 55,094 | 4.9% |
[ 2.0% - 2.5% ] 2.28% | 10,903 | 3.4% |
[ 2.0% - 2.5% ] 2.37% | 51,767 | 3.4% |
[ 2.0% - 2.5% ] 2.48% | 133,569 | 7.0% |
[ 2.5% - 3.0% ] 2.55% | 126,252 | 4.3% |
[ 2.5% - 3.0% ] 2.63% | 48,939 | 6.8% |
[ 2.5% - 3.0% ] 2.74% | 85,513 | 5.5% |
[ 2.5% - 3.0% ] 2.81% | 34,537 | 3.5% |
[ 3.0% - 3.5% ] 3.03% | 24,684 | 8.3% |
[ 3.0% - 3.5% ] 3.10% | 94,089 | 6.3% |
[ 3.0% - 3.5% ] 3.19% | 23,762 | 5.9% |
[ 3.0% - 3.5% ] 3.27% | 33,912 | 3.7% |
[ 3.0% - 3.5% ] 3.34% | 15,556 | 3.3% |
[ 3.0% - 3.5% ] 3.47% | 58,225 | 5.7% |
[ 3.5% - 4.0% ] 3.65% | 3,126 | 4.0% |
[ 3.5% - 4.0% ] 3.70% | 23,980 | 4.9% |
[ 3.5% - 4.0% ] 3.81% | 57,662 | 4.5% |
[ 3.5% - 4.0% ] 3.88% | 15,899 | 2.7% |
[ 4.0% - 4.5% ] 4.12% | 25,699 | 4.8% |
[ 4.0% - 4.5% ] 4.21% | 23,879 | 4.5% |
[ 4.0% - 4.5% ] 4.31% | 81,015 | 6.5% |
[ 4.0% - 4.5% ] 4.36% | 2,039 | 15.1% |
[ 4.0% - 4.5% ] 4.48% | 2,029 | 1.7% |
[ 4.5% - 5.0% ] 4.69% | 14,553 | 7.3% |
[ 4.5% - 5.0% ] 4.78% | 2,219 | 14.9% |
[ 5.0% - 5.5% ] 5.11% | 5,268 | 11.7% |
[ 5.0% - 5.5% ] 5.33% | 37,834 | 3.7% |
[ 6.0% - 6.5% ] 6.45% | 19,501 | 6.5% |
[ 6.5% - 7.0% ] 6.88% | 19,613 | 5.7% |
[ 7.5% - 8.0% ] 7.81% | 39,082 | 1.5% |
[ 7.5% - 8.0% ] 7.92% | 56,794 | 2.9% |
[ 8.5% - 9.0% ] 8.70% | 1,035 | 4.6% |
[ 12.0% - 12.5% ] 12.20% | 738 | 7.1% |
[ 17.0% - 17.5% ] 17.43% | 2,088 | 4.9% |