Immigrants from Burma/Myanmar Male Unemployment

COMPARE

Immigrants from Burma/Myanmar
Race
Ancestry
AfghanAfricanAlaska NativeAlaskan AthabascanAlbanianAleutAlsatianAmericanApacheArabArapahoArgentineanArmenianAssyrian/Chaldean/SyriacAustralianAustrianBahamianBangladeshiBarbadianBasqueBelgianBelizeanBermudanBhutaneseBlackfeetBolivianBrazilianBritishBritish West IndianBulgarianBurmeseCajunCambodianCanadianCape VerdeanCarpatho RusynCelticCentral AmericanCentral American IndianCherokeeCheyenneChickasawChileanChineseChippewaChoctawColombianColvilleComancheCosta RicanCreeCreekCroatianCrowCubanCypriotCzechCzechoslovakianDanishDelawareDominicanDutchDutch West IndianEastern EuropeanEcuadorianEgyptianEnglishEstonianEthiopianEuropeanFijianFilipinoFinnishFrenchFrench American IndianFrench CanadianGermanGerman RussianGhanaianGreekGuamanian/ChamorroGuatemalanGuyaneseHaitianHmongHonduranHopiHoumaHungarianIcelanderIndian (Asian)IndonesianInupiatIranianIraqiIrishIroquoisIsraeliItalianJamaicanJapaneseJordanianKenyanKiowaKoreanLaotianLatvianLebaneseLiberianLithuanianLumbeeLuxembourgerMacedonianMalaysianMalteseMarshalleseMenomineeMexicanMexican American IndianMongolianMoroccanNative HawaiianNavajoNepaleseNew ZealanderNicaraguanNigerianNorthern EuropeanNorwegianOkinawanOsageOttawaPaiutePakistaniPalestinianPanamanianParaguayanPennsylvania GermanPeruvianPimaPolishPortuguesePotawatomiPuebloPuerto RicanPuget Sound SalishRomanianRussianSalvadoranSamoanScandinavianScotch-IrishScottishSeminoleSenegaleseSerbianShoshoneSierra LeoneanSiouxSlavicSlovakSloveneSomaliSouth AfricanSouth AmericanSouth American IndianSoviet UnionSpaniardSpanishSpanish AmericanSpanish American IndianSri LankanSubsaharan AfricanSudaneseSwedishSwissSyrianTaiwaneseThaiTlingit-HaidaTohono O'OdhamTonganTrinidadian and TobagonianTsimshianTurkishU.S. Virgin IslanderUgandanUkrainianUruguayanUteVenezuelanVietnameseWelshWest IndianYakamaYaquiYugoslavianYumanYup'ikZimbabwean
Immigration
NonimmigrantsImmigrantsAfghanistanAfricaAlbaniaArgentinaArmeniaAsiaAustraliaAustriaBahamasBangladeshBarbadosBelarusBelgiumBelizeBoliviaBosnia and HerzegovinaBrazilBulgariaBurma/MyanmarCabo VerdeCambodiaCameroonCanadaCaribbeanCentral AmericaChileChinaColombiaCongoCosta RicaCroatiaCubaCzechoslovakiaDenmarkDominicaDominican RepublicEastern AfricaEastern AsiaEastern EuropeEcuadorEgyptEl SalvadorEnglandEritreaEthiopiaEuropeFijiFranceGermanyGhanaGreeceGrenadaGuatemalaGuyanaHaitiHondurasHong KongHungaryIndiaIndonesiaIranIraqIrelandIsraelItalyJamaicaJapanJordanKazakhstanKenyaKoreaKuwaitLaosLatin AmericaLatviaLebanonLiberiaLithuaniaMalaysiaMexicoMicronesiaMiddle AfricaMoldovaMoroccoNepalNetherlandsNicaraguaNigeriaNorth AmericaNorth MacedoniaNorthern AfricaNorthern EuropeNorwayOceaniaPakistanPanamaPeruPhilippinesPolandPortugalRomaniaRussiaSaudi ArabiaScotlandSenegalSerbiaSierra LeoneSingaporeSomaliaSouth AfricaSouth AmericaSouth Central AsiaSouth Eastern AsiaSouthern EuropeSpainSri LankaSt. Vincent and the GrenadinesSudanSwedenSwitzerlandSyriaTaiwanThailandTrinidad and TobagoTurkeyUgandaUkraineUruguayUzbekistanVenezuelaVietnamWest IndiesWestern AfricaWestern AsiaWestern EuropeYemenZaireZimbabweAzores
Select to Compare
Race
Ancestry
AfghanAfricanAlaska NativeAlaskan AthabascanAlbanianAleutAlsatianAmericanApacheArabArapahoArgentineanArmenianAssyrian/Chaldean/SyriacAustralianAustrianBahamianBangladeshiBarbadianBasqueBelgianBelizeanBermudanBhutaneseBlackfeetBolivianBrazilianBritishBritish West IndianBulgarianBurmeseCajunCambodianCanadianCape VerdeanCarpatho RusynCelticCentral AmericanCentral American IndianCherokeeCheyenneChickasawChileanChineseChippewaChoctawColombianColvilleComancheCosta RicanCreeCreekCroatianCrowCubanCypriotCzechCzechoslovakianDanishDelawareDominicanDutchDutch West IndianEastern EuropeanEcuadorianEgyptianEnglishEstonianEthiopianEuropeanFijianFilipinoFinnishFrenchFrench American IndianFrench CanadianGermanGerman RussianGhanaianGreekGuamanian/ChamorroGuatemalanGuyaneseHaitianHmongHonduranHopiHoumaHungarianIcelanderIndian (Asian)IndonesianInupiatIranianIraqiIrishIroquoisIsraeliItalianJamaicanJapaneseJordanianKenyanKiowaKoreanLaotianLatvianLebaneseLiberianLithuanianLumbeeLuxembourgerMacedonianMalaysianMalteseMarshalleseMenomineeMexicanMexican American IndianMongolianMoroccanNative HawaiianNavajoNepaleseNew ZealanderNicaraguanNigerianNorthern EuropeanNorwegianOkinawanOsageOttawaPaiutePakistaniPalestinianPanamanianParaguayanPennsylvania GermanPeruvianPimaPolishPortuguesePotawatomiPuebloPuerto RicanPuget Sound SalishRomanianRussianSalvadoranSamoanScandinavianScotch-IrishScottishSeminoleSenegaleseSerbianShoshoneSierra LeoneanSiouxSlavicSlovakSloveneSomaliSouth AfricanSouth AmericanSouth American IndianSoviet UnionSpaniardSpanishSpanish AmericanSpanish American IndianSri LankanSubsaharan AfricanSudaneseSwedishSwissSyrianTaiwaneseThaiTlingit-HaidaTohono O'OdhamTonganTrinidadian and TobagonianTsimshianTurkishU.S. Virgin IslanderUgandanUkrainianUruguayanUteVenezuelanVietnameseWelshWest IndianYakamaYaquiYugoslavianYumanYup'ikZimbabwean
Immigration
NonimmigrantsImmigrantsAfghanistanAfricaAlbaniaArgentinaArmeniaAsiaAustraliaAustriaBahamasBangladeshBarbadosBelarusBelgiumBelizeBoliviaBosnia and HerzegovinaBrazilBulgariaCabo VerdeCambodiaCameroonCanadaCaribbeanCentral AmericaChileChinaColombiaCongoCosta RicaCroatiaCubaCzechoslovakiaDenmarkDominicaDominican RepublicEastern AfricaEastern AsiaEastern EuropeEcuadorEgyptEl SalvadorEnglandEritreaEthiopiaEuropeFijiFranceGermanyGhanaGreeceGrenadaGuatemalaGuyanaHaitiHondurasHong KongHungaryIndiaIndonesiaIranIraqIrelandIsraelItalyJamaicaJapanJordanKazakhstanKenyaKoreaKuwaitLaosLatin AmericaLatviaLebanonLiberiaLithuaniaMalaysiaMexicoMicronesiaMiddle AfricaMoldovaMoroccoNepalNetherlandsNicaraguaNigeriaNorth AmericaNorth MacedoniaNorthern AfricaNorthern EuropeNorwayOceaniaPakistanPanamaPeruPhilippinesPolandPortugalRomaniaRussiaSaudi ArabiaScotlandSenegalSerbiaSierra LeoneSingaporeSomaliaSouth AfricaSouth AmericaSouth Central AsiaSouth Eastern AsiaSouthern EuropeSpainSri LankaSt. Vincent and the GrenadinesSudanSwedenSwitzerlandSyriaTaiwanThailandTrinidad and TobagoTurkeyUgandaUkraineUruguayUzbekistanVenezuelaVietnamWest IndiesWestern AfricaWestern AsiaWestern EuropeYemenZaireZimbabweAzores
Male Unemployment
Income
Poverty
Unemployment
Labor Participation
Family Structure
Vehicle Availability
Education Level
Disability

Immigrants from Burma/Myanmar Male Unemployment
Good

5.2%
UNEMPLOYMENT | MALES
77.5/ 100
METRIC RATING
147th/ 347
METRIC RANK

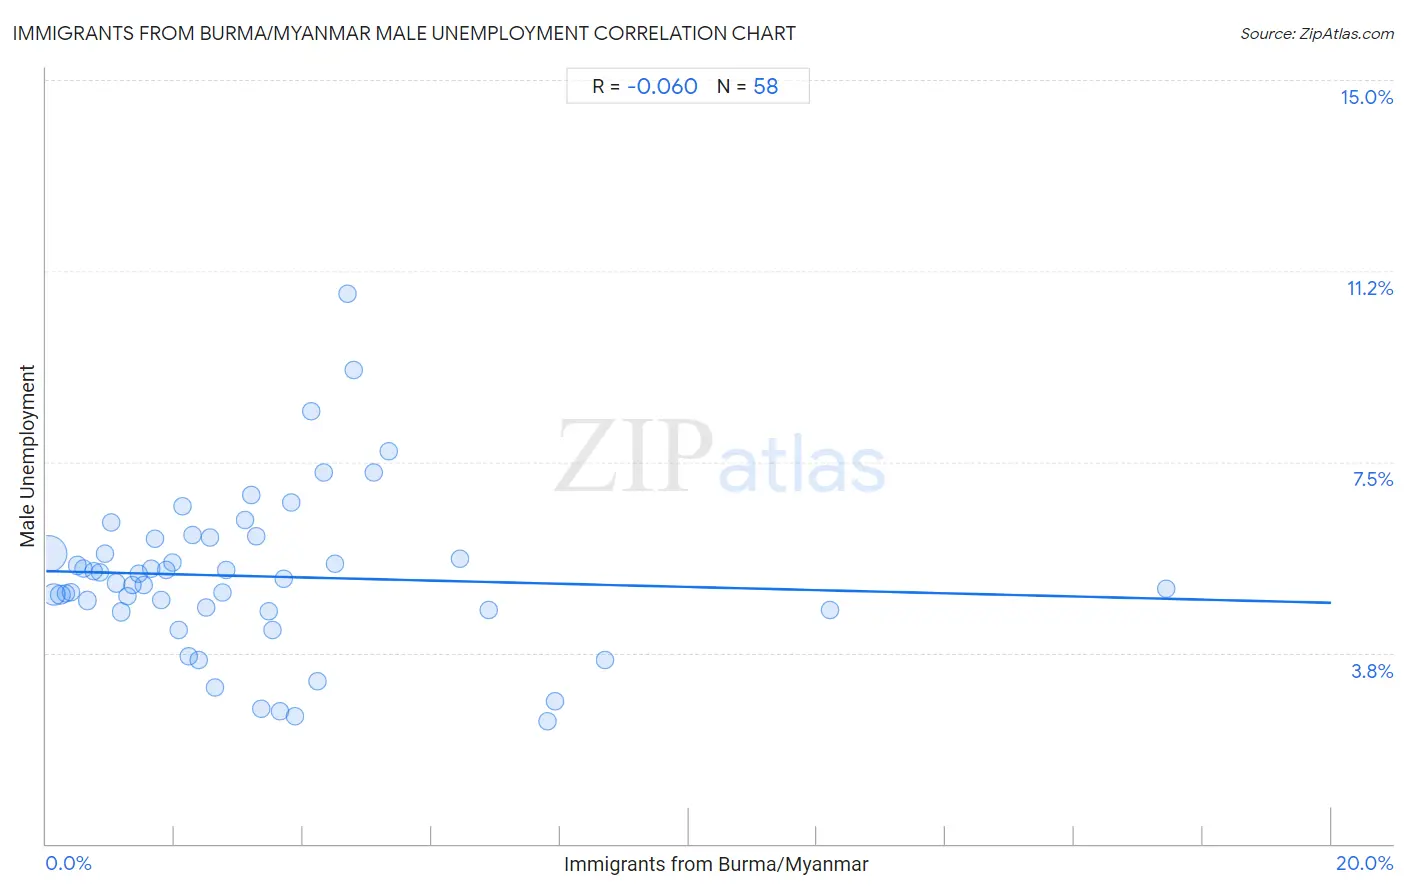
Immigrants from Burma/Myanmar Male Unemployment Correlation Chart

The statistical analysis conducted on geographies consisting of 172,208,828 people shows a slight negative correlation between the proportion of Immigrants from Burma/Myanmar and unemployment rate among males in the United States with a correlation coefficient (R) of -0.060 and weighted average of 5.2%. On average, for every 1% (one percent) increase in Immigrants from Burma/Myanmar within a typical geography, there is a decrease of 0.031% in unemployment rate among males.
Immigrants from Burma/Myanmar Male Unemployment
It is essential to understand that the correlation between the percentage of Immigrants from Burma/Myanmar and unemployment rate among males does not imply a direct cause-and-effect relationship. It remains uncertain whether the presence of Immigrants from Burma/Myanmar influences an upward or downward trend in the level of unemployment rate among males within an area, or if Immigrants from Burma/Myanmar simply ended up residing in those areas with higher or lower levels of unemployment rate among males due to other factors.

Demographics Similar to Immigrants from Burma/Myanmar by Male Unemployment

In terms of male unemployment, the demographic groups most similar to Immigrants from Burma/Myanmar are Immigrants from Kenya (5.2%, a difference of 0.010%), Macedonian (5.2%, a difference of 0.020%), Sri Lankan (5.2%, a difference of 0.030%), Syrian (5.2%, a difference of 0.040%), and Fijian (5.2%, a difference of 0.070%).
DemographicsRating | RankMale Unemployment
Brazilians
79.3
/100
|
#140
Good
5.2%
Immigrants from Switzerland
79.2
/100
|
#141
Good
5.2%
Fijians
78.3
/100
|
#142
Good
5.2%
Syrians
78.0
/100
|
#143
Good
5.2%
Sri Lankans
77.9
/100
|
#144
Good
5.2%
Macedonians
77.7
/100
|
#145
Good
5.2%
Immigrants from Kenya
77.6
/100
|
#146
Good
5.2%
Immigrants from Burma/Myanmar
77.5
/100
|
#147
Good
5.2%
Immigrants from Italy
76.3
/100
|
#148
Good
5.2%
Immigrants from Europe
76.2
/100
|
#149
Good
5.2%
Indians (Asian)
76.0
/100
|
#150
Good
5.2%
Slovaks
75.5
/100
|
#151
Good
5.2%
Egyptians
74.8
/100
|
#152
Good
5.2%
Immigrants from Uruguay
73.9
/100
|
#153
Good
5.2%
Laotians
73.8
/100
|
#154
Good
5.2%

Immigrants from Burma/Myanmar Male Unemployment Correlation Summary

MeasurementImmigrants from Burma/Myanmar DataMale Unemployment Data
Minimum0.038%2.4%
Maximum17.4%10.8%
Range17.4%8.4%
Mean3.2%5.3%
Median2.5%5.2%
Interquartile 25% (IQ1)1.3%4.6%
Interquartile 75% (IQ3)4.1%6.0%
Interquartile Range (IQR)2.9%1.4%
Standard Deviation (Sample)3.0%1.6%
Standard Deviation (Population)3.0%1.6%

Correlation Details

Immigrants from Burma/Myanmar PercentileSample SizeMale Unemployment
[
0.0%
-
0.5%
]
0.038%
109,814,0835.7%
[
0.0%
-
0.5%
]
0.12%
28,026,1044.9%
[
0.0%
-
0.5%
]
0.22%
10,627,4804.9%
[
0.0%
-
0.5%
]
0.30%
4,422,5444.9%
[
0.0%
-
0.5%
]
0.38%
3,391,8514.9%
[
0.0%
-
0.5%
]
0.48%
2,412,7795.5%
[
0.5%
-
1.0%
]
0.58%
2,452,8615.4%
[
0.5%
-
1.0%
]
0.65%
1,513,5294.8%
[
0.5%
-
1.0%
]
0.73%
1,339,8575.4%
[
0.5%
-
1.0%
]
0.84%
1,120,6235.3%
[
0.5%
-
1.0%
]
0.92%
635,7895.7%
[
1.0%
-
1.5%
]
1.00%
591,3866.3%
[
1.0%
-
1.5%
]
1.08%
1,349,8375.1%
[
1.0%
-
1.5%
]
1.17%
423,0924.6%
[
1.0%
-
1.5%
]
1.26%
438,0164.9%
[
1.0%
-
1.5%
]
1.34%
221,3005.1%
[
1.0%
-
1.5%
]
1.43%
406,0895.3%
[
1.5%
-
2.0%
]
1.51%
308,9535.1%
[
1.5%
-
2.0%
]
1.63%
391,8785.4%
[
1.5%
-
2.0%
]
1.69%
182,1556.0%
[
1.5%
-
2.0%
]
1.79%
185,1484.8%
[
1.5%
-
2.0%
]
1.86%
429,5575.4%
[
1.5%
-
2.0%
]
1.97%
19,6265.5%
[
2.0%
-
2.5%
]
2.06%
256,5224.2%
[
2.0%
-
2.5%
]
2.13%
35,4196.6%
[
2.0%
-
2.5%
]
2.22%
55,0943.7%
[
2.0%
-
2.5%
]
2.28%
10,6806.1%
[
2.0%
-
2.5%
]
2.37%
51,7673.6%
[
2.0%
-
2.5%
]
2.48%
133,5694.6%
[
2.5%
-
3.0%
]
2.55%
126,2526.0%
[
2.5%
-
3.0%
]
2.63%
48,9393.1%
[
2.5%
-
3.0%
]
2.74%
85,5134.9%
[
2.5%
-
3.0%
]
2.81%
31,6345.4%
[
3.0%
-
3.5%
]
3.10%
94,0896.4%
[
3.0%
-
3.5%
]
3.19%
24,9716.8%
[
3.0%
-
3.5%
]
3.27%
33,9126.0%
[
3.0%
-
3.5%
]
3.34%
15,5562.6%
[
3.0%
-
3.5%
]
3.47%
57,9364.6%
[
3.5%
-
4.0%
]
3.53%
10,4244.2%
[
3.5%
-
4.0%
]
3.65%
3,1262.6%
[
3.5%
-
4.0%
]
3.70%
23,9805.2%
[
3.5%
-
4.0%
]
3.81%
57,6626.7%
[
3.5%
-
4.0%
]
3.88%
15,8992.5%
[
4.0%
-
4.5%
]
4.12%
25,6998.5%
[
4.0%
-
4.5%
]
4.21%
23,8793.2%
[
4.0%
-
4.5%
]
4.31%
81,0157.3%
[
4.0%
-
4.5%
]
4.48%
2,0295.5%
[
4.5%
-
5.0%
]
4.69%
14,55310.8%
[
4.5%
-
5.0%
]
4.78%
2,2199.3%
[
5.0%
-
5.5%
]
5.11%
5,2687.3%
[
5.0%
-
5.5%
]
5.33%
37,8347.7%
[
6.0%
-
6.5%
]
6.45%
19,5015.6%
[
6.5%
-
7.0%
]
6.88%
19,6134.6%
[
7.5%
-
8.0%
]
7.81%
39,0822.4%
[
7.5%
-
8.0%
]
7.92%
56,7942.8%
[
8.5%
-
9.0%
]
8.70%
1,0353.6%
[
12.0%
-
12.5%
]
12.20%
7384.6%
[
17.0%
-
17.5%
]
17.43%
2,0885.0%