Immigrants from Burma/Myanmar Single Father Poverty

COMPARE

Immigrants from Burma/Myanmar
Race
Ancestry
AfghanAfricanAlaska NativeAlaskan AthabascanAlbanianAleutAlsatianAmericanApacheArabArapahoArgentineanArmenianAssyrian/Chaldean/SyriacAustralianAustrianBahamianBangladeshiBarbadianBasqueBelgianBelizeanBermudanBhutaneseBlackfeetBolivianBrazilianBritishBritish West IndianBulgarianBurmeseCajunCambodianCanadianCape VerdeanCarpatho RusynCelticCentral AmericanCentral American IndianCherokeeCheyenneChickasawChileanChineseChippewaChoctawColombianColvilleComancheCosta RicanCreeCreekCroatianCrowCubanCypriotCzechCzechoslovakianDanishDelawareDominicanDutchDutch West IndianEastern EuropeanEcuadorianEgyptianEnglishEstonianEthiopianEuropeanFijianFilipinoFinnishFrenchFrench American IndianFrench CanadianGermanGerman RussianGhanaianGreekGuamanian/ChamorroGuatemalanGuyaneseHaitianHmongHonduranHopiHoumaHungarianIcelanderIndian (Asian)IndonesianInupiatIranianIraqiIrishIroquoisIsraeliItalianJamaicanJapaneseJordanianKenyanKiowaKoreanLaotianLatvianLebaneseLiberianLithuanianLumbeeLuxembourgerMacedonianMalaysianMalteseMarshalleseMenomineeMexicanMexican American IndianMongolianMoroccanNative HawaiianNavajoNepaleseNew ZealanderNicaraguanNigerianNorthern EuropeanNorwegianOkinawanOsageOttawaPaiutePakistaniPalestinianPanamanianParaguayanPennsylvania GermanPeruvianPimaPolishPortuguesePotawatomiPuebloPuerto RicanPuget Sound SalishRomanianRussianSalvadoranSamoanScandinavianScotch-IrishScottishSeminoleSenegaleseSerbianShoshoneSierra LeoneanSiouxSlavicSlovakSloveneSomaliSouth AfricanSouth AmericanSouth American IndianSoviet UnionSpaniardSpanishSpanish AmericanSpanish American IndianSri LankanSubsaharan AfricanSudaneseSwedishSwissSyrianTaiwaneseThaiTlingit-HaidaTohono O'OdhamTonganTrinidadian and TobagonianTsimshianTurkishU.S. Virgin IslanderUgandanUkrainianUruguayanUteVenezuelanVietnameseWelshWest IndianYakamaYaquiYugoslavianYumanYup'ikZimbabwean
Immigration
NonimmigrantsImmigrantsAfghanistanAfricaAlbaniaArgentinaArmeniaAsiaAustraliaAustriaBahamasBangladeshBarbadosBelarusBelgiumBelizeBoliviaBosnia and HerzegovinaBrazilBulgariaBurma/MyanmarCabo VerdeCambodiaCameroonCanadaCaribbeanCentral AmericaChileChinaColombiaCongoCosta RicaCroatiaCubaCzechoslovakiaDenmarkDominicaDominican RepublicEastern AfricaEastern AsiaEastern EuropeEcuadorEgyptEl SalvadorEnglandEritreaEthiopiaEuropeFijiFranceGermanyGhanaGreeceGrenadaGuatemalaGuyanaHaitiHondurasHong KongHungaryIndiaIndonesiaIranIraqIrelandIsraelItalyJamaicaJapanJordanKazakhstanKenyaKoreaKuwaitLaosLatin AmericaLatviaLebanonLiberiaLithuaniaMalaysiaMexicoMicronesiaMiddle AfricaMoldovaMoroccoNepalNetherlandsNicaraguaNigeriaNorth AmericaNorth MacedoniaNorthern AfricaNorthern EuropeNorwayOceaniaPakistanPanamaPeruPhilippinesPolandPortugalRomaniaRussiaSaudi ArabiaScotlandSenegalSerbiaSierra LeoneSingaporeSomaliaSouth AfricaSouth AmericaSouth Central AsiaSouth Eastern AsiaSouthern EuropeSpainSri LankaSt. Vincent and the GrenadinesSudanSwedenSwitzerlandSyriaTaiwanThailandTrinidad and TobagoTurkeyUgandaUkraineUruguayUzbekistanVenezuelaVietnamWest IndiesWestern AfricaWestern AsiaWestern EuropeYemenZaireZimbabweAzores
Select to Compare
Race
Ancestry
AfghanAfricanAlaska NativeAlaskan AthabascanAlbanianAleutAlsatianAmericanApacheArabArapahoArgentineanArmenianAssyrian/Chaldean/SyriacAustralianAustrianBahamianBangladeshiBarbadianBasqueBelgianBelizeanBermudanBhutaneseBlackfeetBolivianBrazilianBritishBritish West IndianBulgarianBurmeseCajunCambodianCanadianCape VerdeanCarpatho RusynCelticCentral AmericanCentral American IndianCherokeeCheyenneChickasawChileanChineseChippewaChoctawColombianColvilleComancheCosta RicanCreeCreekCroatianCrowCubanCypriotCzechCzechoslovakianDanishDelawareDominicanDutchDutch West IndianEastern EuropeanEcuadorianEgyptianEnglishEstonianEthiopianEuropeanFijianFilipinoFinnishFrenchFrench American IndianFrench CanadianGermanGerman RussianGhanaianGreekGuamanian/ChamorroGuatemalanGuyaneseHaitianHmongHonduranHopiHoumaHungarianIcelanderIndian (Asian)IndonesianInupiatIranianIraqiIrishIroquoisIsraeliItalianJamaicanJapaneseJordanianKenyanKiowaKoreanLaotianLatvianLebaneseLiberianLithuanianLumbeeLuxembourgerMacedonianMalaysianMalteseMarshalleseMenomineeMexicanMexican American IndianMongolianMoroccanNative HawaiianNavajoNepaleseNew ZealanderNicaraguanNigerianNorthern EuropeanNorwegianOkinawanOsageOttawaPaiutePakistaniPalestinianPanamanianParaguayanPennsylvania GermanPeruvianPimaPolishPortuguesePotawatomiPuebloPuerto RicanPuget Sound SalishRomanianRussianSalvadoranSamoanScandinavianScotch-IrishScottishSeminoleSenegaleseSerbianShoshoneSierra LeoneanSiouxSlavicSlovakSloveneSomaliSouth AfricanSouth AmericanSouth American IndianSoviet UnionSpaniardSpanishSpanish AmericanSpanish American IndianSri LankanSubsaharan AfricanSudaneseSwedishSwissSyrianTaiwaneseThaiTlingit-HaidaTohono O'OdhamTonganTrinidadian and TobagonianTsimshianTurkishU.S. Virgin IslanderUgandanUkrainianUruguayanUteVenezuelanVietnameseWelshWest IndianYakamaYaquiYugoslavianYumanYup'ikZimbabwean
Immigration
NonimmigrantsImmigrantsAfghanistanAfricaAlbaniaArgentinaArmeniaAsiaAustraliaAustriaBahamasBangladeshBarbadosBelarusBelgiumBelizeBoliviaBosnia and HerzegovinaBrazilBulgariaCabo VerdeCambodiaCameroonCanadaCaribbeanCentral AmericaChileChinaColombiaCongoCosta RicaCroatiaCubaCzechoslovakiaDenmarkDominicaDominican RepublicEastern AfricaEastern AsiaEastern EuropeEcuadorEgyptEl SalvadorEnglandEritreaEthiopiaEuropeFijiFranceGermanyGhanaGreeceGrenadaGuatemalaGuyanaHaitiHondurasHong KongHungaryIndiaIndonesiaIranIraqIrelandIsraelItalyJamaicaJapanJordanKazakhstanKenyaKoreaKuwaitLaosLatin AmericaLatviaLebanonLiberiaLithuaniaMalaysiaMexicoMicronesiaMiddle AfricaMoldovaMoroccoNepalNetherlandsNicaraguaNigeriaNorth AmericaNorth MacedoniaNorthern AfricaNorthern EuropeNorwayOceaniaPakistanPanamaPeruPhilippinesPolandPortugalRomaniaRussiaSaudi ArabiaScotlandSenegalSerbiaSierra LeoneSingaporeSomaliaSouth AfricaSouth AmericaSouth Central AsiaSouth Eastern AsiaSouthern EuropeSpainSri LankaSt. Vincent and the GrenadinesSudanSwedenSwitzerlandSyriaTaiwanThailandTrinidad and TobagoTurkeyUgandaUkraineUruguayUzbekistanVenezuelaVietnamWest IndiesWestern AfricaWestern AsiaWestern EuropeYemenZaireZimbabweAzores
Single Father Poverty
Income
Poverty
Unemployment
Labor Participation
Family Structure
Vehicle Availability
Education Level
Disability

Immigrants from Burma/Myanmar Single Father Poverty
Fair

16.5%
POVERTY | SINGLE FATHERS
28.0/ 100
METRIC RATING
190th/ 347
METRIC RANK

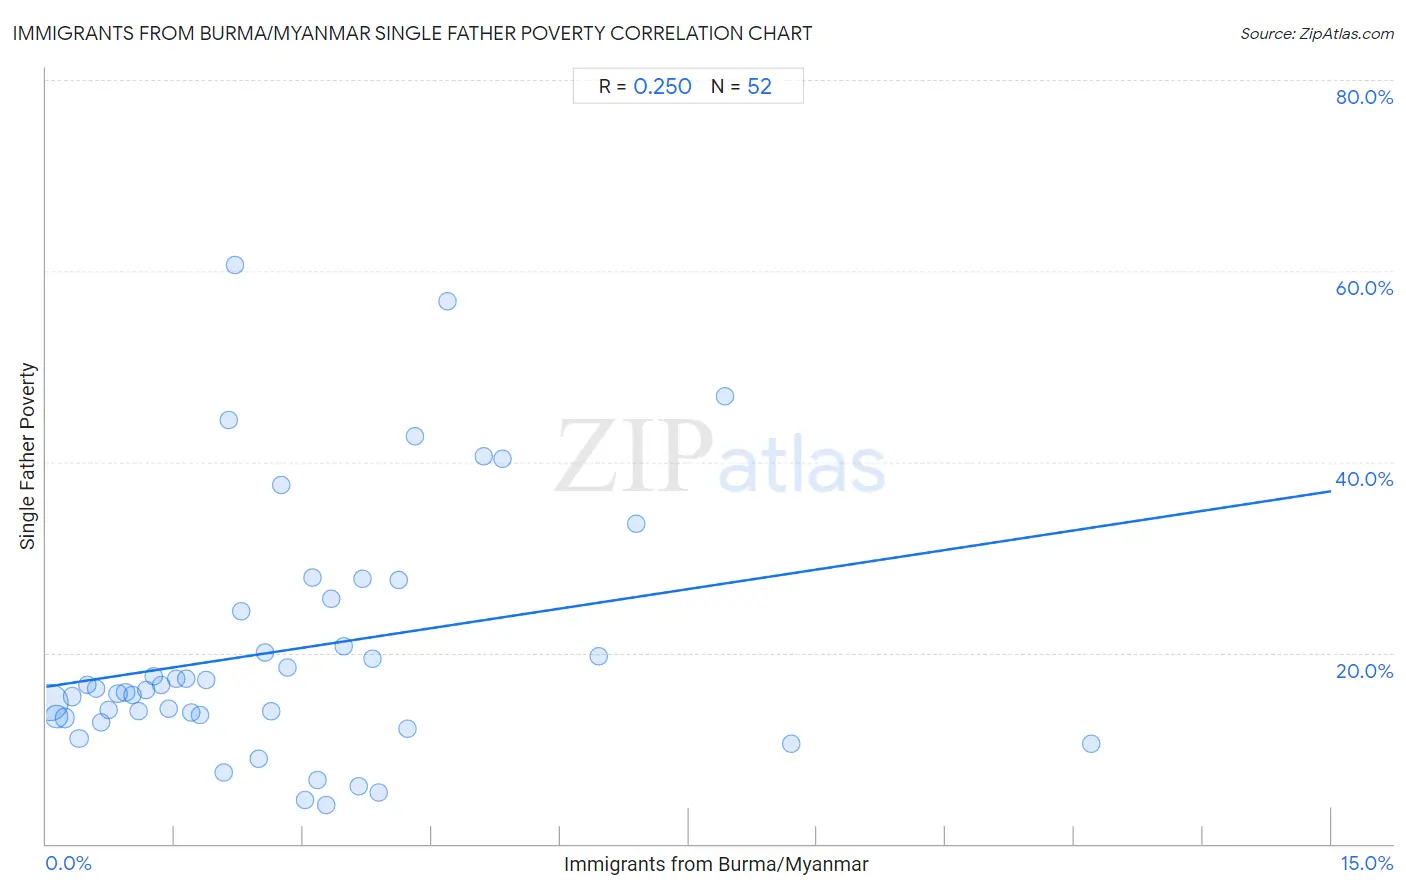
Immigrants from Burma/Myanmar Single Father Poverty Correlation Chart

The statistical analysis conducted on geographies consisting of 151,197,682 people shows a weak positive correlation between the proportion of Immigrants from Burma/Myanmar and poverty level among single fathers in the United States with a correlation coefficient (R) of 0.250 and weighted average of 16.5%. On average, for every 1% (one percent) increase in Immigrants from Burma/Myanmar within a typical geography, there is an increase of 1.4% in poverty level among single fathers.
Immigrants from Burma/Myanmar Single Father Poverty
It is essential to understand that the correlation between the percentage of Immigrants from Burma/Myanmar and poverty level among single fathers does not imply a direct cause-and-effect relationship. It remains uncertain whether the presence of Immigrants from Burma/Myanmar influences an upward or downward trend in the level of poverty level among single fathers within an area, or if Immigrants from Burma/Myanmar simply ended up residing in those areas with higher or lower levels of poverty level among single fathers due to other factors.

Demographics Similar to Immigrants from Burma/Myanmar by Single Father Poverty

In terms of single father poverty, the demographic groups most similar to Immigrants from Burma/Myanmar are Latvian (16.5%, a difference of 0.050%), Immigrants from Guyana (16.5%, a difference of 0.050%), Russian (16.4%, a difference of 0.11%), Ukrainian (16.4%, a difference of 0.12%), and Immigrants from Venezuela (16.4%, a difference of 0.16%).
DemographicsRating | RankSingle Father Poverty
Aleuts
35.3
/100
|
#183
Fair
16.4%
Cambodians
34.6
/100
|
#184
Fair
16.4%
Panamanians
33.6
/100
|
#185
Fair
16.4%
Immigrants from Venezuela
31.0
/100
|
#186
Fair
16.4%
Ukrainians
30.4
/100
|
#187
Fair
16.4%
Russians
30.1
/100
|
#188
Fair
16.4%
Latvians
28.9
/100
|
#189
Fair
16.5%
Immigrants from Burma/Myanmar
28.0
/100
|
#190
Fair
16.5%
Immigrants from Guyana
27.1
/100
|
#191
Fair
16.5%
Immigrants from Switzerland
24.8
/100
|
#192
Fair
16.5%
Ecuadorians
24.5
/100
|
#193
Fair
16.5%
Cape Verdeans
24.4
/100
|
#194
Fair
16.5%
Immigrants from Barbados
24.3
/100
|
#195
Fair
16.5%
Immigrants from Canada
21.9
/100
|
#196
Fair
16.5%
Immigrants from Northern Europe
20.3
/100
|
#197
Fair
16.5%

Immigrants from Burma/Myanmar Single Father Poverty Correlation Summary

MeasurementImmigrants from Burma/Myanmar DataSingle Father Poverty Data
Minimum0.038%4.1%
Maximum12.2%60.6%
Range12.2%56.5%
Mean2.8%20.3%
Median2.4%16.1%
Interquartile 25% (IQ1)1.1%13.3%
Interquartile 75% (IQ3)3.8%25.0%
Interquartile Range (IQR)2.6%11.8%
Standard Deviation (Sample)2.4%13.0%
Standard Deviation (Population)2.4%12.9%

Correlation Details

Immigrants from Burma/Myanmar PercentileSample SizeSingle Father Poverty
[
0.0%
-
0.5%
]
0.038%
99,178,52614.8%
[
0.0%
-
0.5%
]
0.12%
23,856,34313.4%
[
0.0%
-
0.5%
]
0.22%
8,859,70613.2%
[
0.0%
-
0.5%
]
0.30%
3,327,82515.4%
[
0.0%
-
0.5%
]
0.38%
2,731,57711.0%
[
0.0%
-
0.5%
]
0.48%
2,036,84016.6%
[
0.5%
-
1.0%
]
0.58%
2,051,08216.3%
[
0.5%
-
1.0%
]
0.65%
1,289,42612.7%
[
0.5%
-
1.0%
]
0.73%
957,01814.0%
[
0.5%
-
1.0%
]
0.84%
1,041,63915.7%
[
0.5%
-
1.0%
]
0.93%
475,95215.8%
[
1.0%
-
1.5%
]
1.00%
447,01015.5%
[
1.0%
-
1.5%
]
1.08%
1,263,05813.9%
[
1.0%
-
1.5%
]
1.17%
364,02716.0%
[
1.0%
-
1.5%
]
1.26%
364,45417.5%
[
1.0%
-
1.5%
]
1.34%
209,19016.6%
[
1.0%
-
1.5%
]
1.43%
385,50814.1%
[
1.5%
-
2.0%
]
1.52%
268,14717.2%
[
1.5%
-
2.0%
]
1.63%
354,45517.2%
[
1.5%
-
2.0%
]
1.69%
139,84313.8%
[
1.5%
-
2.0%
]
1.79%
132,24113.4%
[
1.5%
-
2.0%
]
1.86%
429,96817.1%
[
2.0%
-
2.5%
]
2.07%
67,1177.4%
[
2.0%
-
2.5%
]
2.13%
34,45544.4%
[
2.0%
-
2.5%
]
2.20%
8,72760.6%
[
2.0%
-
2.5%
]
2.28%
8,80524.4%
[
2.0%
-
2.5%
]
2.47%
103,3068.9%
[
2.5%
-
3.0%
]
2.55%
126,25220.0%
[
2.5%
-
3.0%
]
2.63%
48,93913.9%
[
2.5%
-
3.0%
]
2.74%
20,38837.6%
[
2.5%
-
3.0%
]
2.81%
15,28218.4%
[
3.0%
-
3.5%
]
3.03%
24,6844.6%
[
3.0%
-
3.5%
]
3.10%
94,08927.8%
[
3.0%
-
3.5%
]
3.16%
3,1606.7%
[
3.0%
-
3.5%
]
3.27%
31,9764.1%
[
3.0%
-
3.5%
]
3.33%
2,13525.6%
[
3.0%
-
3.5%
]
3.47%
57,93620.7%
[
3.5%
-
4.0%
]
3.65%
3,1266.1%
[
3.5%
-
4.0%
]
3.70%
23,98027.8%
[
3.5%
-
4.0%
]
3.81%
57,66219.4%
[
3.5%
-
4.0%
]
3.88%
15,8995.3%
[
4.0%
-
4.5%
]
4.12%
25,69927.6%
[
4.0%
-
4.5%
]
4.21%
23,87912.0%
[
4.0%
-
4.5%
]
4.31%
81,01542.7%
[
4.5%
-
5.0%
]
4.69%
14,55356.8%
[
5.0%
-
5.5%
]
5.11%
5,26840.5%
[
5.0%
-
5.5%
]
5.33%
37,83440.3%
[
6.0%
-
6.5%
]
6.45%
19,50119.6%
[
6.5%
-
7.0%
]
6.88%
19,61333.6%
[
7.5%
-
8.0%
]
7.92%
56,79446.9%
[
8.5%
-
9.0%
]
8.70%
1,03510.5%
[
12.0%
-
12.5%
]
12.20%
73810.5%