Immigrants from Burma/Myanmar Family Households
COMPARE
Immigrants from Burma/Myanmar
Select to Compare
Family Households
Immigrants from Burma/Myanmar Family Households
62.6%
FAMILY HOUSEHOLDS
0.0/ 100
METRIC RATING
292nd/ 347
METRIC RANK
Immigrants from Burma/Myanmar Family Households Correlation Chart
The statistical analysis conducted on geographies consisting of 172,273,179 people shows a mild positive correlation between the proportion of Immigrants from Burma/Myanmar and percentage of family households in the United States with a correlation coefficient (R) of 0.318 and weighted average of 62.6%. On average, for every 1% (one percent) increase in Immigrants from Burma/Myanmar within a typical geography, there is an increase of 0.63% in percentage of family households.
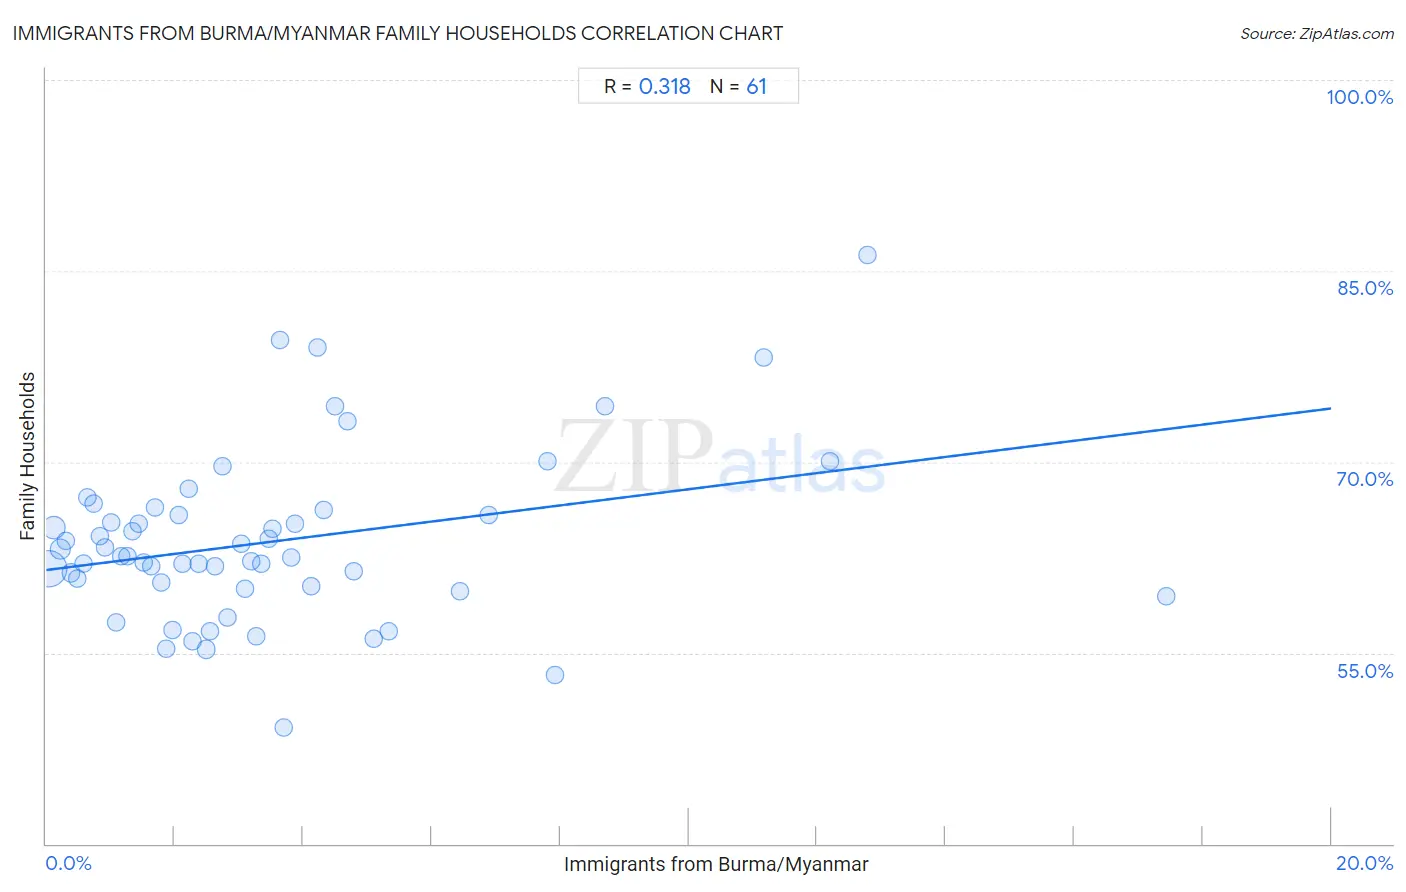
It is essential to understand that the correlation between the percentage of Immigrants from Burma/Myanmar and percentage of family households does not imply a direct cause-and-effect relationship. It remains uncertain whether the presence of Immigrants from Burma/Myanmar influences an upward or downward trend in the level of percentage of family households within an area, or if Immigrants from Burma/Myanmar simply ended up residing in those areas with higher or lower levels of percentage of family households due to other factors.
Demographics Similar to Immigrants from Burma/Myanmar by Family Households
In terms of family households, the demographic groups most similar to Immigrants from Burma/Myanmar are U.S. Virgin Islander (62.6%, a difference of 0.050%), Immigrants from Grenada (62.6%, a difference of 0.10%), Immigrants from Sweden (62.5%, a difference of 0.13%), Immigrants from Nepal (62.7%, a difference of 0.18%), and Barbadian (62.5%, a difference of 0.19%).
| Demographics | Rating | Rank | Family Households |
| Mongolians | 0.1 /100 | #285 | Tragic 62.8% |
| British West Indians | 0.1 /100 | #286 | Tragic 62.8% |
| Latvians | 0.1 /100 | #287 | Tragic 62.8% |
| Immigrants from Uganda | 0.1 /100 | #288 | Tragic 62.7% |
| Immigrants from Nepal | 0.1 /100 | #289 | Tragic 62.7% |
| Immigrants from Grenada | 0.0 /100 | #290 | Tragic 62.6% |
| U.S. Virgin Islanders | 0.0 /100 | #291 | Tragic 62.6% |
| Immigrants from Burma/Myanmar | 0.0 /100 | #292 | Tragic 62.6% |
| Immigrants from Sweden | 0.0 /100 | #293 | Tragic 62.5% |
| Barbadians | 0.0 /100 | #294 | Tragic 62.5% |
| Okinawans | 0.0 /100 | #295 | Tragic 62.5% |
| Slovenes | 0.0 /100 | #296 | Tragic 62.4% |
| French American Indians | 0.0 /100 | #297 | Tragic 62.4% |
| Immigrants from Spain | 0.0 /100 | #298 | Tragic 62.4% |
| Immigrants from Kuwait | 0.0 /100 | #299 | Tragic 62.4% |
Immigrants from Burma/Myanmar Family Households Correlation Summary
| Measurement | Immigrants from Burma/Myanmar Data | Family Households Data |
| Minimum | 0.038% | 49.1% |
| Maximum | 17.4% | 86.2% |
| Range | 17.4% | 37.1% |
| Mean | 3.5% | 63.7% |
| Median | 2.6% | 62.5% |
| Interquartile 25% (IQ1) | 1.3% | 60.1% |
| Interquartile 75% (IQ3) | 4.3% | 66.0% |
| Interquartile Range (IQR) | 3.0% | 5.9% |
| Standard Deviation (Sample) | 3.4% | 6.7% |
| Standard Deviation (Population) | 3.3% | 6.6% |
Correlation Details
| Immigrants from Burma/Myanmar Percentile | Sample Size | Family Households |
[ 0.0% - 0.5% ] 0.038% | 109,818,160 | 61.6% |
[ 0.0% - 0.5% ] 0.12% | 28,011,806 | 64.9% |
[ 0.0% - 0.5% ] 0.22% | 10,626,900 | 63.1% |
[ 0.0% - 0.5% ] 0.30% | 4,419,737 | 63.8% |
[ 0.0% - 0.5% ] 0.38% | 3,395,444 | 61.3% |
[ 0.0% - 0.5% ] 0.48% | 2,415,377 | 60.8% |
[ 0.5% - 1.0% ] 0.58% | 2,459,066 | 62.0% |
[ 0.5% - 1.0% ] 0.65% | 1,513,851 | 67.2% |
[ 0.5% - 1.0% ] 0.73% | 1,356,368 | 66.7% |
[ 0.5% - 1.0% ] 0.84% | 1,123,551 | 64.1% |
[ 0.5% - 1.0% ] 0.92% | 636,007 | 63.3% |
[ 1.0% - 1.5% ] 1.00% | 592,676 | 65.3% |
[ 1.0% - 1.5% ] 1.08% | 1,357,765 | 57.4% |
[ 1.0% - 1.5% ] 1.17% | 419,756 | 62.6% |
[ 1.0% - 1.5% ] 1.26% | 438,016 | 62.5% |
[ 1.0% - 1.5% ] 1.34% | 223,860 | 64.5% |
[ 1.0% - 1.5% ] 1.43% | 406,228 | 65.2% |
[ 1.5% - 2.0% ] 1.51% | 310,391 | 62.1% |
[ 1.5% - 2.0% ] 1.63% | 392,187 | 61.8% |
[ 1.5% - 2.0% ] 1.69% | 182,155 | 66.4% |
[ 1.5% - 2.0% ] 1.79% | 185,148 | 60.6% |
[ 1.5% - 2.0% ] 1.86% | 432,147 | 55.3% |
[ 1.5% - 2.0% ] 1.97% | 19,626 | 56.8% |
[ 2.0% - 2.5% ] 2.06% | 256,522 | 65.8% |
[ 2.0% - 2.5% ] 2.13% | 35,419 | 62.0% |
[ 2.0% - 2.5% ] 2.22% | 55,094 | 67.9% |
[ 2.0% - 2.5% ] 2.29% | 12,866 | 55.9% |
[ 2.0% - 2.5% ] 2.37% | 51,767 | 62.0% |
[ 2.0% - 2.5% ] 2.48% | 133,569 | 55.3% |
[ 2.5% - 3.0% ] 2.55% | 126,252 | 56.7% |
[ 2.5% - 3.0% ] 2.63% | 48,939 | 61.8% |
[ 2.5% - 3.0% ] 2.74% | 85,513 | 69.6% |
[ 2.5% - 3.0% ] 2.81% | 34,537 | 57.7% |
[ 3.0% - 3.5% ] 3.03% | 24,684 | 63.5% |
[ 3.0% - 3.5% ] 3.10% | 94,089 | 60.0% |
[ 3.0% - 3.5% ] 3.19% | 24,971 | 62.2% |
[ 3.0% - 3.5% ] 3.27% | 33,912 | 56.3% |
[ 3.0% - 3.5% ] 3.34% | 15,556 | 61.9% |
[ 3.0% - 3.5% ] 3.47% | 58,574 | 63.9% |
[ 3.5% - 4.0% ] 3.53% | 12,010 | 64.8% |
[ 3.5% - 4.0% ] 3.65% | 3,126 | 79.6% |
[ 3.5% - 4.0% ] 3.70% | 23,980 | 49.1% |
[ 3.5% - 4.0% ] 3.81% | 57,662 | 62.5% |
[ 3.5% - 4.0% ] 3.88% | 15,899 | 65.2% |
[ 4.0% - 4.5% ] 4.12% | 25,699 | 60.3% |
[ 4.0% - 4.5% ] 4.21% | 23,879 | 79.0% |
[ 4.0% - 4.5% ] 4.31% | 81,015 | 66.2% |
[ 4.0% - 4.5% ] 4.48% | 2,029 | 74.4% |
[ 4.5% - 5.0% ] 4.69% | 14,553 | 73.2% |
[ 4.5% - 5.0% ] 4.78% | 2,219 | 61.4% |
[ 5.0% - 5.5% ] 5.11% | 5,268 | 56.1% |
[ 5.0% - 5.5% ] 5.33% | 37,834 | 56.7% |
[ 6.0% - 6.5% ] 6.45% | 19,501 | 59.8% |
[ 6.5% - 7.0% ] 6.88% | 19,613 | 65.8% |
[ 7.5% - 8.0% ] 7.81% | 39,082 | 70.1% |
[ 7.5% - 8.0% ] 7.92% | 56,794 | 53.3% |
[ 8.5% - 9.0% ] 8.70% | 1,035 | 74.3% |
[ 11.0% - 11.5% ] 11.17% | 403 | 78.2% |
[ 12.0% - 12.5% ] 12.20% | 738 | 70.1% |
[ 12.5% - 13.0% ] 12.78% | 266 | 86.2% |
[ 17.0% - 17.5% ] 17.43% | 2,088 | 59.4% |