Immigrants from Burma/Myanmar Median Family Income
COMPARE
Immigrants from Burma/Myanmar
Select to Compare
Median Family Income
Immigrants from Burma/Myanmar Median Family Income
$94,472
FAMILY INCOME
1.5/ 100
METRIC RATING
235th/ 347
METRIC RANK
Immigrants from Burma/Myanmar Median Family Income Correlation Chart
The statistical analysis conducted on geographies consisting of 172,231,822 people shows a mild negative correlation between the proportion of Immigrants from Burma/Myanmar and median family income in the United States with a correlation coefficient (R) of -0.339 and weighted average of $94,472. On average, for every 1% (one percent) increase in Immigrants from Burma/Myanmar within a typical geography, there is a decrease of $2,359 in median family income.
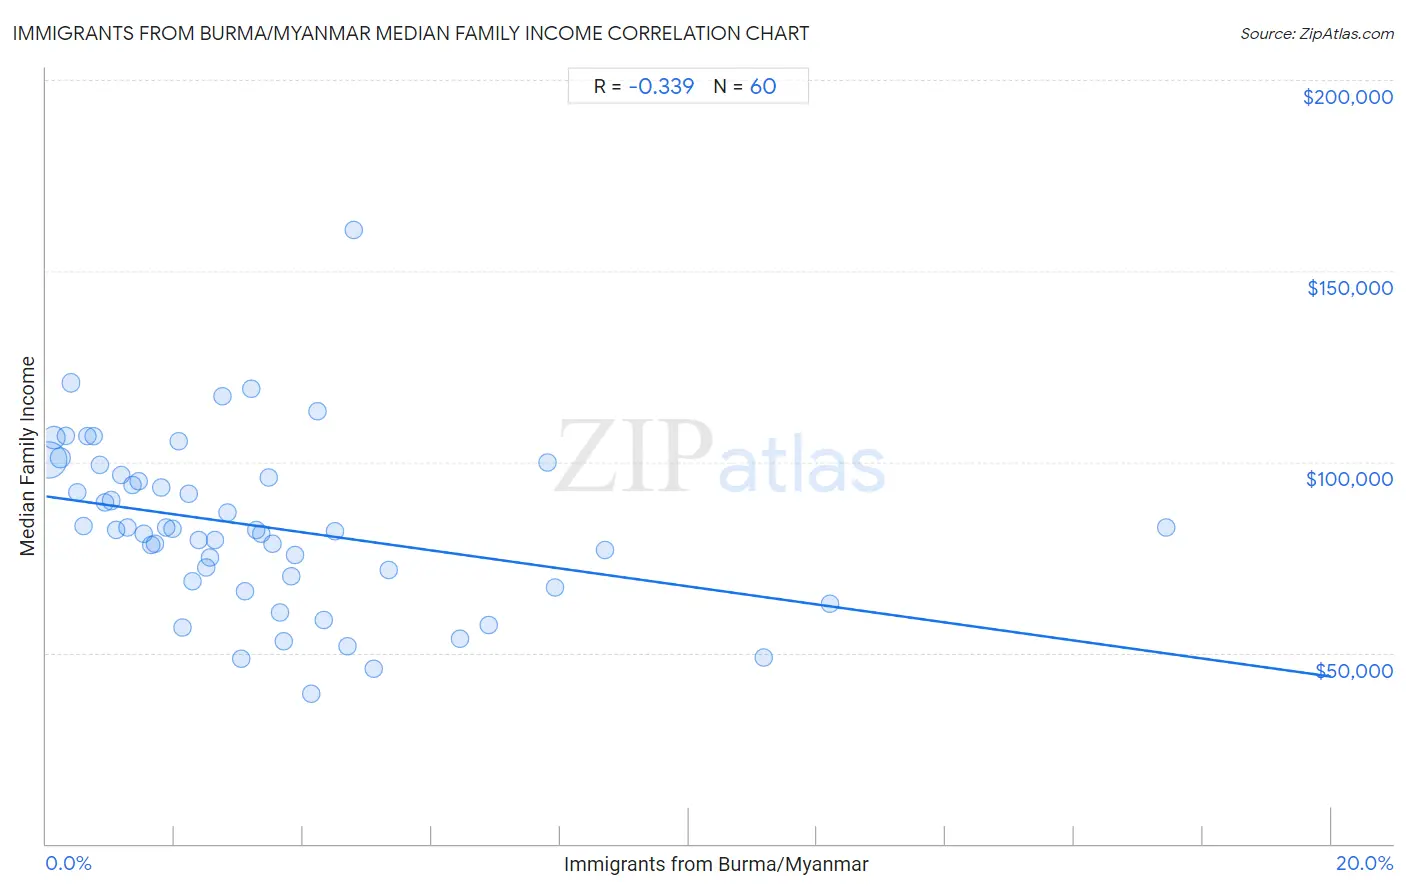
It is essential to understand that the correlation between the percentage of Immigrants from Burma/Myanmar and median family income does not imply a direct cause-and-effect relationship. It remains uncertain whether the presence of Immigrants from Burma/Myanmar influences an upward or downward trend in the level of median family income within an area, or if Immigrants from Burma/Myanmar simply ended up residing in those areas with higher or lower levels of median family income due to other factors.
Demographics Similar to Immigrants from Burma/Myanmar by Median Family Income
In terms of median family income, the demographic groups most similar to Immigrants from Burma/Myanmar are Trinidadian and Tobagonian ($94,466, a difference of 0.010%), Alaskan Athabascan ($94,429, a difference of 0.040%), Immigrants from Western Africa ($94,638, a difference of 0.18%), Immigrants from Bangladesh ($94,665, a difference of 0.20%), and Nepalese ($94,153, a difference of 0.34%).
| Demographics | Rating | Rank | Median Family Income |
| Immigrants from the Azores | 2.4 /100 | #228 | Tragic $95,402 |
| Marshallese | 2.2 /100 | #229 | Tragic $95,293 |
| Malaysians | 2.2 /100 | #230 | Tragic $95,230 |
| Ecuadorians | 2.1 /100 | #231 | Tragic $95,114 |
| Immigrants from Venezuela | 1.9 /100 | #232 | Tragic $94,904 |
| Immigrants from Bangladesh | 1.6 /100 | #233 | Tragic $94,665 |
| Immigrants from Western Africa | 1.6 /100 | #234 | Tragic $94,638 |
| Immigrants from Burma/Myanmar | 1.5 /100 | #235 | Tragic $94,472 |
| Trinidadians and Tobagonians | 1.5 /100 | #236 | Tragic $94,466 |
| Alaskan Athabascans | 1.5 /100 | #237 | Tragic $94,429 |
| Nepalese | 1.3 /100 | #238 | Tragic $94,153 |
| Salvadorans | 1.2 /100 | #239 | Tragic $94,109 |
| Somalis | 1.2 /100 | #240 | Tragic $94,085 |
| Immigrants from Trinidad and Tobago | 1.2 /100 | #241 | Tragic $93,988 |
| Barbadians | 1.1 /100 | #242 | Tragic $93,919 |
Immigrants from Burma/Myanmar Median Family Income Correlation Summary
| Measurement | Immigrants from Burma/Myanmar Data | Median Family Income Data |
| Minimum | 0.038% | $39,136 |
| Maximum | 17.4% | $160,863 |
| Range | 17.4% | $121,727 |
| Mean | 3.3% | $83,083 |
| Median | 2.6% | $82,122 |
| Interquartile 25% (IQ1) | 1.3% | $69,331 |
| Interquartile 75% (IQ3) | 4.2% | $96,286 |
| Interquartile Range (IQR) | 2.9% | $26,955 |
| Standard Deviation (Sample) | 3.2% | $21,974 |
| Standard Deviation (Population) | 3.1% | $21,790 |
Correlation Details
| Immigrants from Burma/Myanmar Percentile | Sample Size | Median Family Income |
[ 0.0% - 0.5% ] 0.038% | 109,811,681 | $100,421 |
[ 0.0% - 0.5% ] 0.12% | 28,003,948 | $106,329 |
[ 0.0% - 0.5% ] 0.22% | 10,618,269 | $101,094 |
[ 0.0% - 0.5% ] 0.30% | 4,417,125 | $106,752 |
[ 0.0% - 0.5% ] 0.38% | 3,395,444 | $120,763 |
[ 0.0% - 0.5% ] 0.48% | 2,403,819 | $92,017 |
[ 0.5% - 1.0% ] 0.58% | 2,459,066 | $83,100 |
[ 0.5% - 1.0% ] 0.65% | 1,513,851 | $106,803 |
[ 0.5% - 1.0% ] 0.73% | 1,356,368 | $106,616 |
[ 0.5% - 1.0% ] 0.84% | 1,123,551 | $99,223 |
[ 0.5% - 1.0% ] 0.92% | 636,007 | $89,343 |
[ 1.0% - 1.5% ] 1.00% | 592,676 | $89,856 |
[ 1.0% - 1.5% ] 1.08% | 1,357,765 | $82,147 |
[ 1.0% - 1.5% ] 1.17% | 419,756 | $96,599 |
[ 1.0% - 1.5% ] 1.26% | 438,016 | $82,844 |
[ 1.0% - 1.5% ] 1.34% | 223,860 | $94,011 |
[ 1.0% - 1.5% ] 1.43% | 406,228 | $94,923 |
[ 1.5% - 2.0% ] 1.51% | 310,391 | $81,321 |
[ 1.5% - 2.0% ] 1.63% | 391,878 | $78,334 |
[ 1.5% - 2.0% ] 1.69% | 182,155 | $78,464 |
[ 1.5% - 2.0% ] 1.79% | 185,148 | $93,233 |
[ 1.5% - 2.0% ] 1.86% | 432,147 | $82,892 |
[ 1.5% - 2.0% ] 1.97% | 19,626 | $82,585 |
[ 2.0% - 2.5% ] 2.06% | 256,522 | $105,557 |
[ 2.0% - 2.5% ] 2.13% | 35,419 | $56,676 |
[ 2.0% - 2.5% ] 2.22% | 55,094 | $91,603 |
[ 2.0% - 2.5% ] 2.29% | 12,866 | $68,742 |
[ 2.0% - 2.5% ] 2.37% | 51,767 | $79,697 |
[ 2.0% - 2.5% ] 2.48% | 133,569 | $72,233 |
[ 2.5% - 3.0% ] 2.55% | 126,252 | $74,943 |
[ 2.5% - 3.0% ] 2.63% | 48,939 | $79,646 |
[ 2.5% - 3.0% ] 2.74% | 85,513 | $117,053 |
[ 2.5% - 3.0% ] 2.81% | 33,467 | $86,783 |
[ 3.0% - 3.5% ] 3.03% | 24,684 | $48,288 |
[ 3.0% - 3.5% ] 3.10% | 94,089 | $65,991 |
[ 3.0% - 3.5% ] 3.19% | 24,971 | $119,235 |
[ 3.0% - 3.5% ] 3.27% | 31,976 | $82,097 |
[ 3.0% - 3.5% ] 3.34% | 15,556 | $81,133 |
[ 3.0% - 3.5% ] 3.47% | 57,936 | $95,974 |
[ 3.5% - 4.0% ] 3.53% | 12,010 | $78,617 |
[ 3.5% - 4.0% ] 3.65% | 3,126 | $60,417 |
[ 3.5% - 4.0% ] 3.70% | 23,980 | $53,186 |
[ 3.5% - 4.0% ] 3.81% | 57,662 | $69,920 |
[ 3.5% - 4.0% ] 3.88% | 15,899 | $75,704 |
[ 4.0% - 4.5% ] 4.12% | 25,699 | $39,136 |
[ 4.0% - 4.5% ] 4.21% | 23,879 | $113,314 |
[ 4.0% - 4.5% ] 4.31% | 81,015 | $58,689 |
[ 4.0% - 4.5% ] 4.48% | 2,029 | $81,688 |
[ 4.5% - 5.0% ] 4.69% | 14,553 | $51,730 |
[ 4.5% - 5.0% ] 4.78% | 2,219 | $160,863 |
[ 5.0% - 5.5% ] 5.11% | 5,268 | $45,724 |
[ 5.0% - 5.5% ] 5.33% | 37,834 | $71,636 |
[ 6.0% - 6.5% ] 6.45% | 19,501 | $53,541 |
[ 6.5% - 7.0% ] 6.88% | 19,613 | $57,128 |
[ 7.5% - 8.0% ] 7.81% | 39,082 | $99,931 |
[ 7.5% - 8.0% ] 7.92% | 56,794 | $67,204 |
[ 8.5% - 9.0% ] 8.70% | 1,035 | $76,786 |
[ 11.0% - 11.5% ] 11.17% | 403 | $48,750 |
[ 12.0% - 12.5% ] 12.20% | 738 | $62,750 |
[ 17.0% - 17.5% ] 17.43% | 2,088 | $82,961 |