Immigrants from Burma/Myanmar Married-Couple Family Poverty
COMPARE
Immigrants from Burma/Myanmar
Select to Compare
Married-Couple Family Poverty
Immigrants from Burma/Myanmar Married-Couple Family Poverty
6.0%
POVERTY | MARRIED-COUPLE FAMILIES
0.5/ 100
METRIC RATING
257th/ 347
METRIC RANK
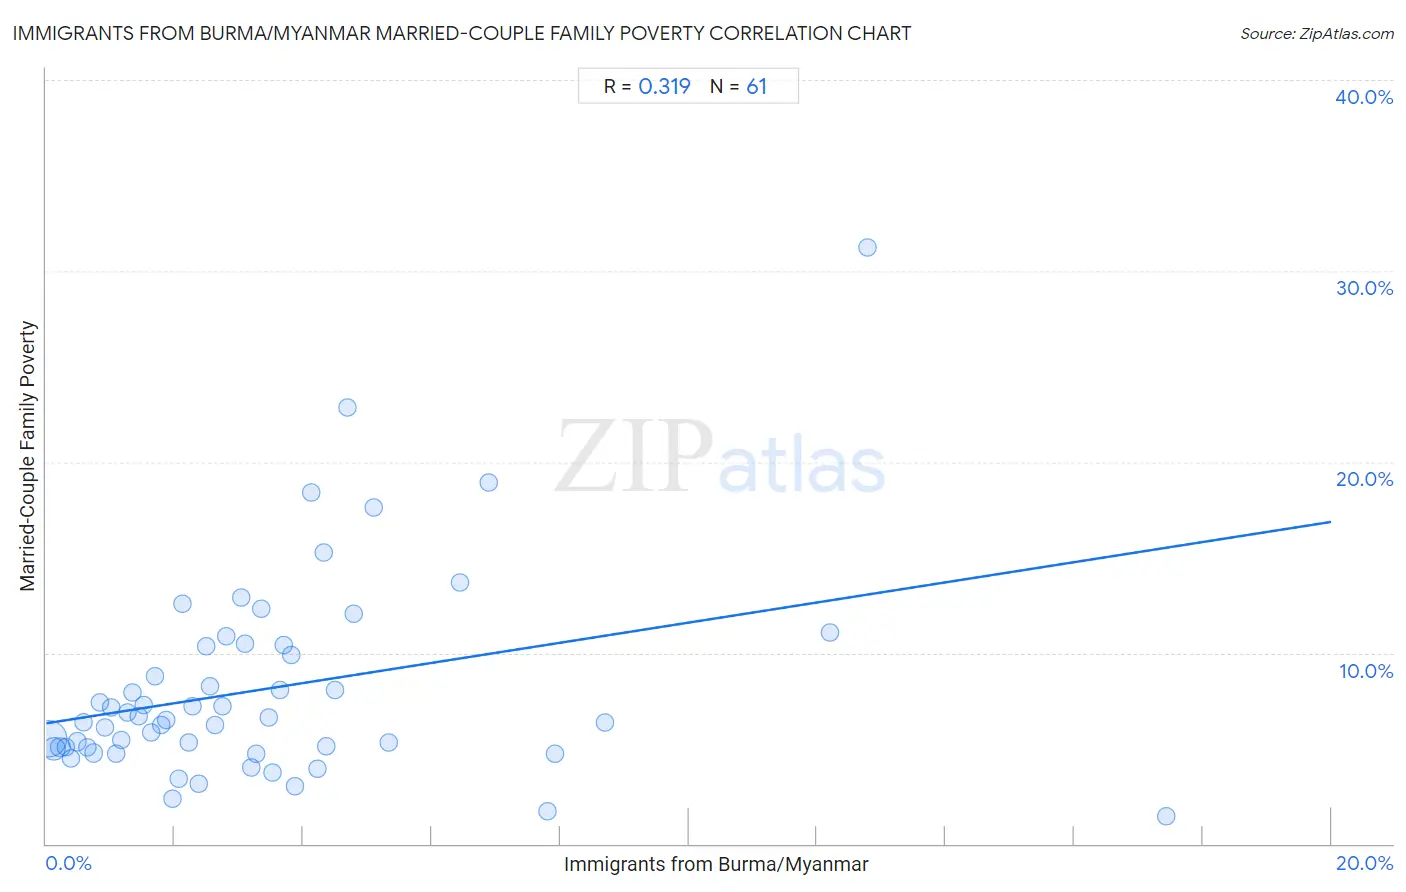
Immigrants from Burma/Myanmar Married-Couple Family Poverty Correlation Chart
The statistical analysis conducted on geographies consisting of 171,978,611 people shows a mild positive correlation between the proportion of Immigrants from Burma/Myanmar and poverty level among married-couple families in the United States with a correlation coefficient (R) of 0.319 and weighted average of 6.0%. On average, for every 1% (one percent) increase in Immigrants from Burma/Myanmar within a typical geography, there is an increase of 0.53% in poverty level among married-couple families.
It is essential to understand that the correlation between the percentage of Immigrants from Burma/Myanmar and poverty level among married-couple families does not imply a direct cause-and-effect relationship. It remains uncertain whether the presence of Immigrants from Burma/Myanmar influences an upward or downward trend in the level of poverty level among married-couple families within an area, or if Immigrants from Burma/Myanmar simply ended up residing in those areas with higher or lower levels of poverty level among married-couple families due to other factors.
Demographics Similar to Immigrants from Burma/Myanmar by Married-Couple Family Poverty
In terms of married-couple family poverty, the demographic groups most similar to Immigrants from Burma/Myanmar are Immigrants (6.0%, a difference of 0.13%), Bangladeshi (6.0%, a difference of 0.24%), Alaskan Athabascan (6.1%, a difference of 0.71%), Comanche (6.0%, a difference of 0.74%), and Immigrants from Somalia (6.0%, a difference of 0.89%).
| Demographics | Rating | Rank | Married-Couple Family Poverty |
| Immigrants from Eritrea | 1.1 /100 | #250 | Tragic 5.9% |
| Immigrants from Ghana | 1.0 /100 | #251 | Tragic 5.9% |
| Immigrants from Western Asia | 0.7 /100 | #252 | Tragic 6.0% |
| Africans | 0.7 /100 | #253 | Tragic 6.0% |
| Immigrants from Somalia | 0.7 /100 | #254 | Tragic 6.0% |
| Comanche | 0.7 /100 | #255 | Tragic 6.0% |
| Bangladeshis | 0.5 /100 | #256 | Tragic 6.0% |
| Immigrants from Burma/Myanmar | 0.5 /100 | #257 | Tragic 6.0% |
| Immigrants | 0.5 /100 | #258 | Tragic 6.0% |
| Alaskan Athabascans | 0.4 /100 | #259 | Tragic 6.1% |
| Jamaicans | 0.3 /100 | #260 | Tragic 6.1% |
| Senegalese | 0.3 /100 | #261 | Tragic 6.1% |
| Shoshone | 0.3 /100 | #262 | Tragic 6.1% |
| Immigrants from Senegal | 0.3 /100 | #263 | Tragic 6.1% |
| Immigrants from Congo | 0.2 /100 | #264 | Tragic 6.1% |
Immigrants from Burma/Myanmar Married-Couple Family Poverty Correlation Summary
| Measurement | Immigrants from Burma/Myanmar Data | Married-Couple Family Poverty Data |
| Minimum | 0.038% | 1.4% |
| Maximum | 17.4% | 31.2% |
| Range | 17.4% | 29.8% |
| Mean | 3.4% | 8.1% |
| Median | 2.6% | 6.5% |
| Interquartile 25% (IQ1) | 1.3% | 5.0% |
| Interquartile 75% (IQ3) | 4.3% | 10.4% |
| Interquartile Range (IQR) | 3.0% | 5.4% |
| Standard Deviation (Sample) | 3.2% | 5.3% |
| Standard Deviation (Population) | 3.2% | 5.3% |
Correlation Details
| Immigrants from Burma/Myanmar Percentile | Sample Size | Married-Couple Family Poverty |
[ 0.0% - 0.5% ] 0.038% | 109,776,834 | 5.5% |
[ 0.0% - 0.5% ] 0.12% | 27,971,346 | 5.0% |
[ 0.0% - 0.5% ] 0.22% | 10,582,609 | 5.0% |
[ 0.0% - 0.5% ] 0.30% | 4,414,227 | 5.1% |
[ 0.0% - 0.5% ] 0.38% | 3,367,510 | 4.5% |
[ 0.0% - 0.5% ] 0.48% | 2,381,031 | 5.4% |
[ 0.5% - 1.0% ] 0.58% | 2,449,337 | 6.4% |
[ 0.5% - 1.0% ] 0.65% | 1,511,674 | 5.1% |
[ 0.5% - 1.0% ] 0.73% | 1,352,244 | 4.8% |
[ 0.5% - 1.0% ] 0.84% | 1,118,936 | 7.4% |
[ 0.5% - 1.0% ] 0.92% | 618,746 | 6.1% |
[ 1.0% - 1.5% ] 1.00% | 592,676 | 7.2% |
[ 1.0% - 1.5% ] 1.08% | 1,357,028 | 4.7% |
[ 1.0% - 1.5% ] 1.17% | 419,756 | 5.5% |
[ 1.0% - 1.5% ] 1.26% | 435,223 | 6.9% |
[ 1.0% - 1.5% ] 1.34% | 221,300 | 7.9% |
[ 1.0% - 1.5% ] 1.43% | 406,228 | 6.7% |
[ 1.5% - 2.0% ] 1.51% | 310,391 | 7.3% |
[ 1.5% - 2.0% ] 1.63% | 392,187 | 5.8% |
[ 1.5% - 2.0% ] 1.69% | 178,707 | 8.8% |
[ 1.5% - 2.0% ] 1.79% | 144,374 | 6.2% |
[ 1.5% - 2.0% ] 1.86% | 432,147 | 6.5% |
[ 1.5% - 2.0% ] 1.97% | 19,626 | 2.3% |
[ 2.0% - 2.5% ] 2.06% | 256,522 | 3.4% |
[ 2.0% - 2.5% ] 2.13% | 35,419 | 12.6% |
[ 2.0% - 2.5% ] 2.22% | 53,324 | 5.3% |
[ 2.0% - 2.5% ] 2.29% | 12,866 | 7.2% |
[ 2.0% - 2.5% ] 2.37% | 51,767 | 3.1% |
[ 2.0% - 2.5% ] 2.48% | 133,569 | 10.4% |
[ 2.5% - 3.0% ] 2.55% | 126,252 | 8.3% |
[ 2.5% - 3.0% ] 2.63% | 48,939 | 6.2% |
[ 2.5% - 3.0% ] 2.74% | 85,513 | 7.2% |
[ 2.5% - 3.0% ] 2.81% | 30,609 | 10.9% |
[ 3.0% - 3.5% ] 3.03% | 24,684 | 12.9% |
[ 3.0% - 3.5% ] 3.10% | 94,089 | 10.5% |
[ 3.0% - 3.5% ] 3.19% | 24,971 | 4.0% |
[ 3.0% - 3.5% ] 3.27% | 31,976 | 4.7% |
[ 3.0% - 3.5% ] 3.35% | 13,421 | 12.3% |
[ 3.0% - 3.5% ] 3.47% | 58,574 | 6.6% |
[ 3.5% - 4.0% ] 3.52% | 7,660 | 3.7% |
[ 3.5% - 4.0% ] 3.65% | 3,126 | 8.0% |
[ 3.5% - 4.0% ] 3.70% | 23,980 | 10.4% |
[ 3.5% - 4.0% ] 3.81% | 57,662 | 9.9% |
[ 3.5% - 4.0% ] 3.88% | 15,899 | 3.0% |
[ 4.0% - 4.5% ] 4.12% | 25,699 | 18.4% |
[ 4.0% - 4.5% ] 4.21% | 23,879 | 3.9% |
[ 4.0% - 4.5% ] 4.31% | 81,015 | 15.3% |
[ 4.0% - 4.5% ] 4.36% | 2,039 | 5.1% |
[ 4.0% - 4.5% ] 4.48% | 2,029 | 8.0% |
[ 4.5% - 5.0% ] 4.69% | 14,553 | 22.9% |
[ 4.5% - 5.0% ] 4.78% | 2,219 | 12.0% |
[ 5.0% - 5.5% ] 5.11% | 5,268 | 17.6% |
[ 5.0% - 5.5% ] 5.33% | 37,834 | 5.3% |
[ 6.0% - 6.5% ] 6.45% | 19,501 | 13.7% |
[ 6.5% - 7.0% ] 6.88% | 19,613 | 18.9% |
[ 7.5% - 8.0% ] 7.81% | 39,082 | 1.7% |
[ 7.5% - 8.0% ] 7.92% | 56,794 | 4.7% |
[ 8.5% - 9.0% ] 8.70% | 1,035 | 6.3% |
[ 12.0% - 12.5% ] 12.20% | 738 | 11.0% |
[ 12.5% - 13.0% ] 12.78% | 266 | 31.2% |
[ 17.0% - 17.5% ] 17.43% | 2,088 | 1.4% |