Immigrants from Burma/Myanmar Child Poverty Under the Age of 5
COMPARE
Immigrants from Burma/Myanmar
Select to Compare
Child Poverty Under the Age of 5
Immigrants from Burma/Myanmar Child Poverty Under the Age of 5
20.4%
POVERTY | CHILDREN < 5
0.1/ 100
METRIC RATING
269th/ 347
METRIC RANK
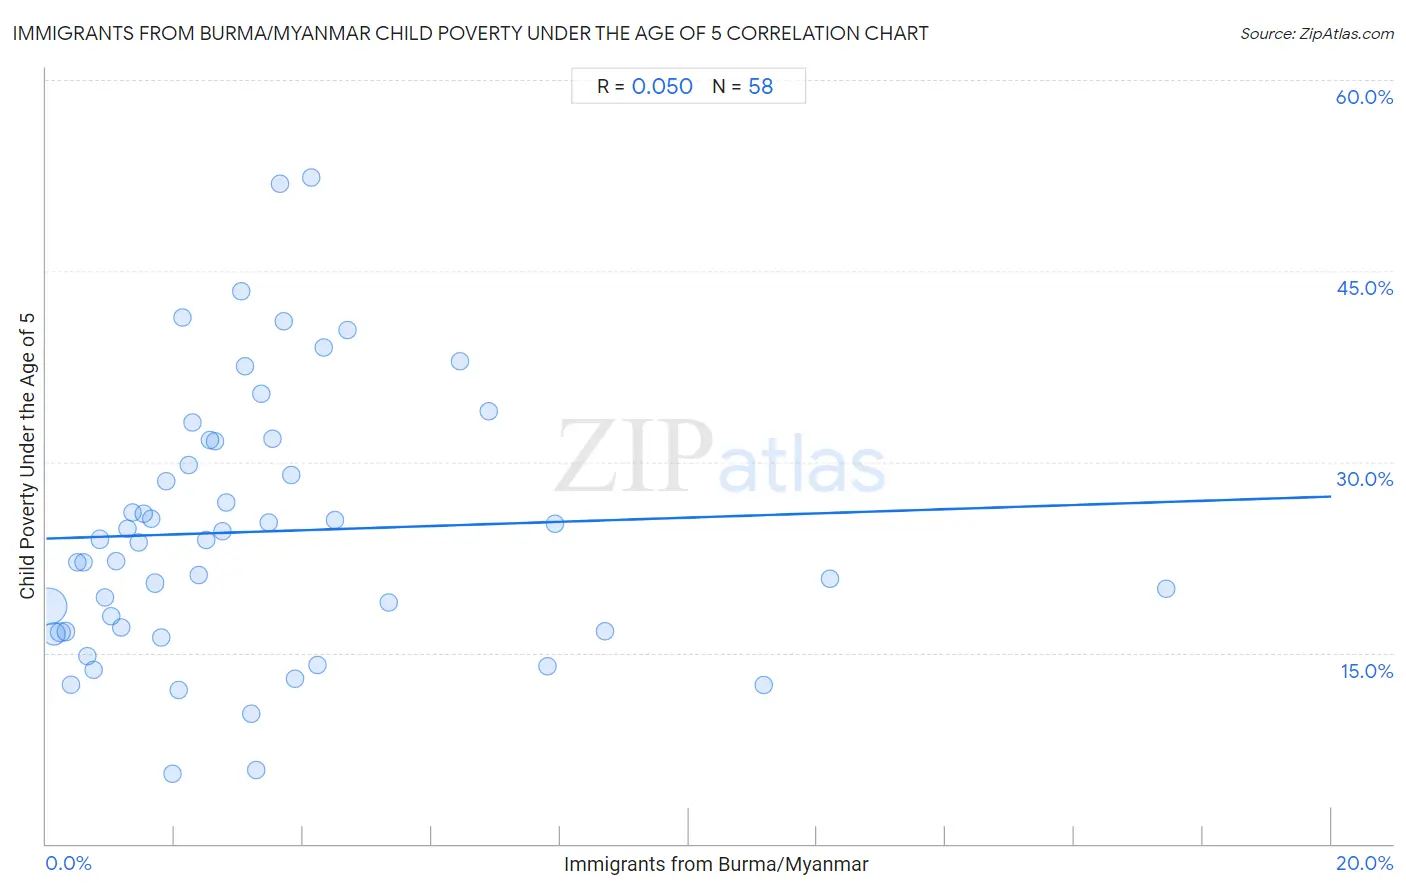
Immigrants from Burma/Myanmar Child Poverty Under the Age of 5 Correlation Chart
The statistical analysis conducted on geographies consisting of 169,386,512 people shows a slight positive correlation between the proportion of Immigrants from Burma/Myanmar and poverty level among children under the age of 5 in the United States with a correlation coefficient (R) of 0.050 and weighted average of 20.4%. On average, for every 1% (one percent) increase in Immigrants from Burma/Myanmar within a typical geography, there is an increase of 0.17% in poverty level among children under the age of 5.
It is essential to understand that the correlation between the percentage of Immigrants from Burma/Myanmar and poverty level among children under the age of 5 does not imply a direct cause-and-effect relationship. It remains uncertain whether the presence of Immigrants from Burma/Myanmar influences an upward or downward trend in the level of poverty level among children under the age of 5 within an area, or if Immigrants from Burma/Myanmar simply ended up residing in those areas with higher or lower levels of poverty level among children under the age of 5 due to other factors.
Demographics Similar to Immigrants from Burma/Myanmar by Child Poverty Under the Age of 5
In terms of child poverty under the age of 5, the demographic groups most similar to Immigrants from Burma/Myanmar are Jamaican (20.4%, a difference of 0.070%), Ottawa (20.3%, a difference of 0.090%), Belizean (20.3%, a difference of 0.090%), Aleut (20.3%, a difference of 0.48%), and American (20.5%, a difference of 0.52%).
| Demographics | Rating | Rank | Child Poverty Under the Age of 5 |
| Liberians | 0.1 /100 | #262 | Tragic 20.2% |
| Barbadians | 0.1 /100 | #263 | Tragic 20.2% |
| Immigrants from Liberia | 0.1 /100 | #264 | Tragic 20.2% |
| Spanish American Indians | 0.1 /100 | #265 | Tragic 20.2% |
| Aleuts | 0.1 /100 | #266 | Tragic 20.3% |
| Ottawa | 0.1 /100 | #267 | Tragic 20.3% |
| Belizeans | 0.1 /100 | #268 | Tragic 20.3% |
| Immigrants from Burma/Myanmar | 0.1 /100 | #269 | Tragic 20.4% |
| Jamaicans | 0.1 /100 | #270 | Tragic 20.4% |
| Americans | 0.1 /100 | #271 | Tragic 20.5% |
| Immigrants from Jamaica | 0.1 /100 | #272 | Tragic 20.5% |
| Central Americans | 0.1 /100 | #273 | Tragic 20.6% |
| Immigrants from Belize | 0.1 /100 | #274 | Tragic 20.6% |
| Bangladeshis | 0.1 /100 | #275 | Tragic 20.6% |
| West Indians | 0.0 /100 | #276 | Tragic 20.6% |
Immigrants from Burma/Myanmar Child Poverty Under the Age of 5 Correlation Summary
| Measurement | Immigrants from Burma/Myanmar Data | Child Poverty Under the Age of 5 Data |
| Minimum | 0.038% | 5.5% |
| Maximum | 17.4% | 52.3% |
| Range | 17.4% | 46.9% |
| Mean | 3.3% | 24.5% |
| Median | 2.5% | 23.8% |
| Interquartile 25% (IQ1) | 1.3% | 16.7% |
| Interquartile 75% (IQ3) | 3.9% | 31.6% |
| Interquartile Range (IQR) | 2.6% | 15.0% |
| Standard Deviation (Sample) | 3.2% | 10.5% |
| Standard Deviation (Population) | 3.2% | 10.4% |
Correlation Details
| Immigrants from Burma/Myanmar Percentile | Sample Size | Child Poverty Under the Age of 5 |
[ 0.0% - 0.5% ] 0.038% | 108,728,063 | 18.7% |
[ 0.0% - 0.5% ] 0.12% | 27,317,512 | 16.5% |
[ 0.0% - 0.5% ] 0.22% | 10,260,727 | 16.6% |
[ 0.0% - 0.5% ] 0.30% | 4,237,124 | 16.7% |
[ 0.0% - 0.5% ] 0.38% | 3,203,862 | 12.5% |
[ 0.0% - 0.5% ] 0.48% | 2,247,070 | 22.1% |
[ 0.5% - 1.0% ] 0.58% | 2,448,370 | 22.1% |
[ 0.5% - 1.0% ] 0.65% | 1,485,123 | 14.7% |
[ 0.5% - 1.0% ] 0.73% | 1,315,317 | 13.7% |
[ 0.5% - 1.0% ] 0.84% | 1,118,936 | 23.9% |
[ 0.5% - 1.0% ] 0.92% | 628,258 | 19.3% |
[ 1.0% - 1.5% ] 1.00% | 589,961 | 17.9% |
[ 1.0% - 1.5% ] 1.08% | 1,328,297 | 22.2% |
[ 1.0% - 1.5% ] 1.17% | 419,756 | 17.0% |
[ 1.0% - 1.5% ] 1.26% | 438,016 | 24.7% |
[ 1.0% - 1.5% ] 1.34% | 209,190 | 26.0% |
[ 1.0% - 1.5% ] 1.43% | 400,636 | 23.7% |
[ 1.5% - 2.0% ] 1.51% | 305,738 | 25.9% |
[ 1.5% - 2.0% ] 1.63% | 385,199 | 25.5% |
[ 1.5% - 2.0% ] 1.69% | 178,707 | 20.5% |
[ 1.5% - 2.0% ] 1.79% | 175,927 | 16.2% |
[ 1.5% - 2.0% ] 1.86% | 430,770 | 28.5% |
[ 1.5% - 2.0% ] 1.97% | 19,626 | 5.5% |
[ 2.0% - 2.5% ] 2.06% | 256,522 | 12.1% |
[ 2.0% - 2.5% ] 2.13% | 35,419 | 41.3% |
[ 2.0% - 2.5% ] 2.22% | 55,094 | 29.8% |
[ 2.0% - 2.5% ] 2.29% | 12,866 | 33.1% |
[ 2.0% - 2.5% ] 2.37% | 51,767 | 21.1% |
[ 2.0% - 2.5% ] 2.48% | 132,627 | 23.9% |
[ 2.5% - 3.0% ] 2.55% | 126,252 | 31.8% |
[ 2.5% - 3.0% ] 2.63% | 48,939 | 31.6% |
[ 2.5% - 3.0% ] 2.74% | 85,513 | 24.6% |
[ 2.5% - 3.0% ] 2.81% | 30,609 | 26.8% |
[ 3.0% - 3.5% ] 3.03% | 24,684 | 43.4% |
[ 3.0% - 3.5% ] 3.10% | 94,089 | 37.5% |
[ 3.0% - 3.5% ] 3.19% | 24,971 | 10.2% |
[ 3.0% - 3.5% ] 3.27% | 31,976 | 5.8% |
[ 3.0% - 3.5% ] 3.35% | 13,421 | 35.4% |
[ 3.0% - 3.5% ] 3.47% | 58,574 | 25.2% |
[ 3.5% - 4.0% ] 3.52% | 6,074 | 31.8% |
[ 3.5% - 4.0% ] 3.65% | 3,126 | 51.9% |
[ 3.5% - 4.0% ] 3.70% | 23,980 | 41.0% |
[ 3.5% - 4.0% ] 3.81% | 57,662 | 29.0% |
[ 3.5% - 4.0% ] 3.88% | 15,899 | 13.0% |
[ 4.0% - 4.5% ] 4.12% | 25,699 | 52.3% |
[ 4.0% - 4.5% ] 4.21% | 23,879 | 14.1% |
[ 4.0% - 4.5% ] 4.31% | 81,015 | 39.0% |
[ 4.0% - 4.5% ] 4.48% | 2,029 | 25.5% |
[ 4.5% - 5.0% ] 4.69% | 14,553 | 40.3% |
[ 5.0% - 5.5% ] 5.33% | 37,834 | 19.0% |
[ 6.0% - 6.5% ] 6.45% | 19,501 | 37.9% |
[ 6.5% - 7.0% ] 6.88% | 19,613 | 34.0% |
[ 7.5% - 8.0% ] 7.81% | 39,082 | 14.0% |
[ 7.5% - 8.0% ] 7.92% | 56,794 | 25.1% |
[ 8.5% - 9.0% ] 8.70% | 1,035 | 16.7% |
[ 11.0% - 11.5% ] 11.17% | 403 | 12.5% |
[ 12.0% - 12.5% ] 12.20% | 738 | 20.8% |
[ 17.0% - 17.5% ] 17.43% | 2,088 | 20.0% |