Immigrants from Burma/Myanmar Births to Unmarried Women
COMPARE
Immigrants from Burma/Myanmar
Select to Compare
Births to Unmarried Women
Immigrants from Burma/Myanmar Births to Unmarried Women
32.9%
BIRTHS TO UNMARRIED WOMEN
16.7/ 100
METRIC RATING
201st/ 347
METRIC RANK
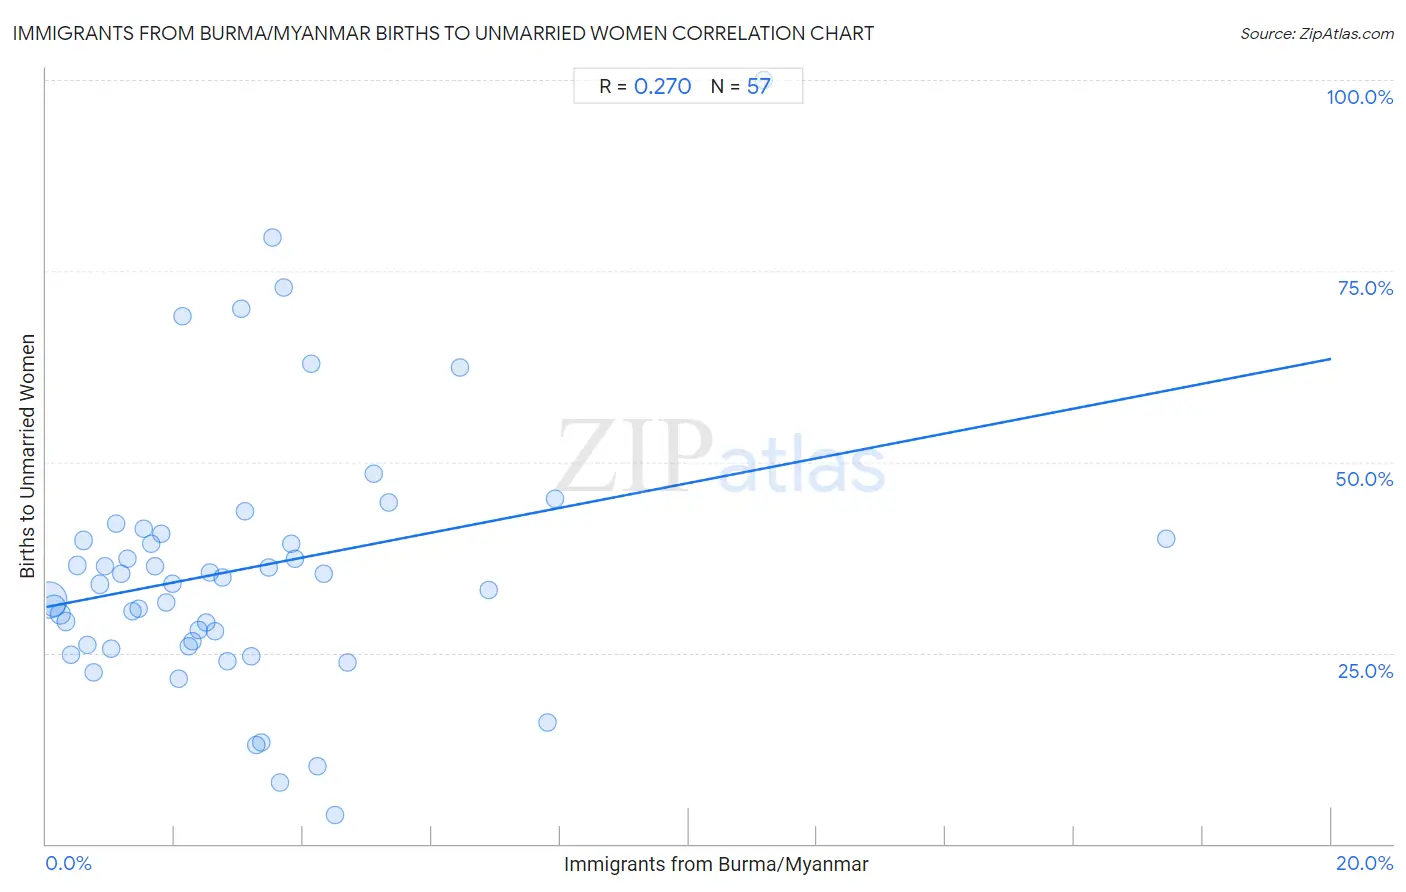
Immigrants from Burma/Myanmar Births to Unmarried Women Correlation Chart
The statistical analysis conducted on geographies consisting of 166,895,809 people shows a weak positive correlation between the proportion of Immigrants from Burma/Myanmar and percentage of births to unmarried women in the United States with a correlation coefficient (R) of 0.270 and weighted average of 32.9%. On average, for every 1% (one percent) increase in Immigrants from Burma/Myanmar within a typical geography, there is an increase of 1.6% in percentage of births to unmarried women.
It is essential to understand that the correlation between the percentage of Immigrants from Burma/Myanmar and percentage of births to unmarried women does not imply a direct cause-and-effect relationship. It remains uncertain whether the presence of Immigrants from Burma/Myanmar influences an upward or downward trend in the level of percentage of births to unmarried women within an area, or if Immigrants from Burma/Myanmar simply ended up residing in those areas with higher or lower levels of percentage of births to unmarried women due to other factors.
Demographics Similar to Immigrants from Burma/Myanmar by Births to Unmarried Women
In terms of births to unmarried women, the demographic groups most similar to Immigrants from Burma/Myanmar are Immigrants from Micronesia (32.9%, a difference of 0.010%), Immigrants from Germany (32.8%, a difference of 0.33%), Immigrants from Thailand (32.8%, a difference of 0.34%), Ute (33.0%, a difference of 0.39%), and Immigrants from Africa (33.0%, a difference of 0.41%).
| Demographics | Rating | Rank | Births to Unmarried Women |
| Sudanese | 27.3 /100 | #194 | Fair 32.4% |
| Samoans | 21.9 /100 | #195 | Fair 32.6% |
| Immigrants from Colombia | 21.7 /100 | #196 | Fair 32.6% |
| Immigrants | 20.6 /100 | #197 | Fair 32.7% |
| Costa Ricans | 20.3 /100 | #198 | Fair 32.7% |
| Immigrants from Thailand | 18.9 /100 | #199 | Poor 32.8% |
| Immigrants from Germany | 18.8 /100 | #200 | Poor 32.8% |
| Immigrants from Burma/Myanmar | 16.7 /100 | #201 | Poor 32.9% |
| Immigrants from Micronesia | 16.6 /100 | #202 | Poor 32.9% |
| Ute | 14.4 /100 | #203 | Poor 33.0% |
| Immigrants from Africa | 14.3 /100 | #204 | Poor 33.0% |
| German Russians | 13.1 /100 | #205 | Poor 33.1% |
| Uruguayans | 12.8 /100 | #206 | Poor 33.1% |
| Immigrants from Sudan | 11.5 /100 | #207 | Poor 33.2% |
| Hawaiians | 11.3 /100 | #208 | Poor 33.2% |
Immigrants from Burma/Myanmar Births to Unmarried Women Correlation Summary
| Measurement | Immigrants from Burma/Myanmar Data | Births to Unmarried Women Data |
| Minimum | 0.038% | 3.8% |
| Maximum | 17.4% | 100.0% |
| Range | 17.4% | 96.2% |
| Mean | 3.1% | 36.0% |
| Median | 2.5% | 34.0% |
| Interquartile 25% (IQ1) | 1.2% | 25.9% |
| Interquartile 75% (IQ3) | 3.8% | 40.3% |
| Interquartile Range (IQR) | 2.6% | 14.4% |
| Standard Deviation (Sample) | 2.9% | 17.5% |
| Standard Deviation (Population) | 2.9% | 17.4% |
Correlation Details
| Immigrants from Burma/Myanmar Percentile | Sample Size | Births to Unmarried Women |
[ 0.0% - 0.5% ] 0.038% | 107,460,432 | 31.9% |
[ 0.0% - 0.5% ] 0.12% | 26,594,863 | 31.2% |
[ 0.0% - 0.5% ] 0.22% | 10,141,187 | 30.1% |
[ 0.0% - 0.5% ] 0.30% | 4,164,353 | 29.1% |
[ 0.0% - 0.5% ] 0.38% | 3,258,307 | 24.8% |
[ 0.0% - 0.5% ] 0.48% | 2,244,099 | 36.4% |
[ 0.5% - 1.0% ] 0.58% | 2,376,039 | 39.7% |
[ 0.5% - 1.0% ] 0.65% | 1,430,907 | 26.0% |
[ 0.5% - 1.0% ] 0.73% | 1,308,170 | 22.4% |
[ 0.5% - 1.0% ] 0.84% | 1,118,328 | 34.0% |
[ 0.5% - 1.0% ] 0.92% | 622,914 | 36.3% |
[ 1.0% - 1.5% ] 1.00% | 570,228 | 25.5% |
[ 1.0% - 1.5% ] 1.08% | 1,291,109 | 42.0% |
[ 1.0% - 1.5% ] 1.18% | 410,203 | 35.4% |
[ 1.0% - 1.5% ] 1.26% | 423,187 | 37.4% |
[ 1.0% - 1.5% ] 1.34% | 209,190 | 30.4% |
[ 1.0% - 1.5% ] 1.43% | 387,909 | 30.7% |
[ 1.5% - 2.0% ] 1.52% | 266,524 | 41.3% |
[ 1.5% - 2.0% ] 1.63% | 357,249 | 39.2% |
[ 1.5% - 2.0% ] 1.69% | 178,707 | 36.4% |
[ 1.5% - 2.0% ] 1.79% | 144,374 | 40.5% |
[ 1.5% - 2.0% ] 1.86% | 429,968 | 31.5% |
[ 1.5% - 2.0% ] 1.97% | 19,626 | 34.0% |
[ 2.0% - 2.5% ] 2.06% | 256,522 | 21.7% |
[ 2.0% - 2.5% ] 2.13% | 34,455 | 69.0% |
[ 2.0% - 2.5% ] 2.22% | 41,544 | 25.8% |
[ 2.0% - 2.5% ] 2.28% | 12,562 | 26.5% |
[ 2.0% - 2.5% ] 2.37% | 51,767 | 28.0% |
[ 2.0% - 2.5% ] 2.48% | 133,569 | 29.0% |
[ 2.5% - 3.0% ] 2.55% | 126,252 | 35.5% |
[ 2.5% - 3.0% ] 2.63% | 48,939 | 27.9% |
[ 2.5% - 3.0% ] 2.74% | 85,513 | 34.8% |
[ 2.5% - 3.0% ] 2.82% | 15,237 | 23.9% |
[ 3.0% - 3.5% ] 3.03% | 24,684 | 70.0% |
[ 3.0% - 3.5% ] 3.10% | 94,089 | 43.6% |
[ 3.0% - 3.5% ] 3.19% | 24,971 | 24.6% |
[ 3.0% - 3.5% ] 3.27% | 31,976 | 13.0% |
[ 3.0% - 3.5% ] 3.35% | 13,421 | 13.3% |
[ 3.0% - 3.5% ] 3.47% | 57,936 | 36.2% |
[ 3.5% - 4.0% ] 3.52% | 6,074 | 79.3% |
[ 3.5% - 4.0% ] 3.65% | 3,126 | 8.0% |
[ 3.5% - 4.0% ] 3.70% | 23,980 | 72.9% |
[ 3.5% - 4.0% ] 3.81% | 57,662 | 39.2% |
[ 3.5% - 4.0% ] 3.88% | 15,899 | 37.3% |
[ 4.0% - 4.5% ] 4.12% | 25,699 | 62.8% |
[ 4.0% - 4.5% ] 4.21% | 23,879 | 10.1% |
[ 4.0% - 4.5% ] 4.31% | 81,015 | 35.3% |
[ 4.0% - 4.5% ] 4.48% | 2,029 | 3.8% |
[ 4.5% - 5.0% ] 4.69% | 14,553 | 23.8% |
[ 5.0% - 5.5% ] 5.11% | 5,268 | 48.5% |
[ 5.0% - 5.5% ] 5.33% | 37,834 | 44.7% |
[ 6.0% - 6.5% ] 6.45% | 19,501 | 62.4% |
[ 6.5% - 7.0% ] 6.88% | 19,613 | 33.3% |
[ 7.5% - 8.0% ] 7.81% | 39,082 | 15.9% |
[ 7.5% - 8.0% ] 7.92% | 56,794 | 45.1% |
[ 11.0% - 11.5% ] 11.17% | 403 | 100.0% |
[ 17.0% - 17.5% ] 17.43% | 2,088 | 40.0% |