Immigrants from Burma/Myanmar Unemployment Among Women with Children Ages 6 to 17 years
COMPARE
Immigrants from Burma/Myanmar
Select to Compare
Unemployment Among Women with Children Ages 6 to 17 years
Immigrants from Burma/Myanmar Unemployment Among Women with Children Ages 6 to 17 years
7.5%
UNEMPLOYMENT | WOMEN W/ CHILDREN 6 TO 17
100.0/ 100
METRIC RATING
16th/ 347
METRIC RANK
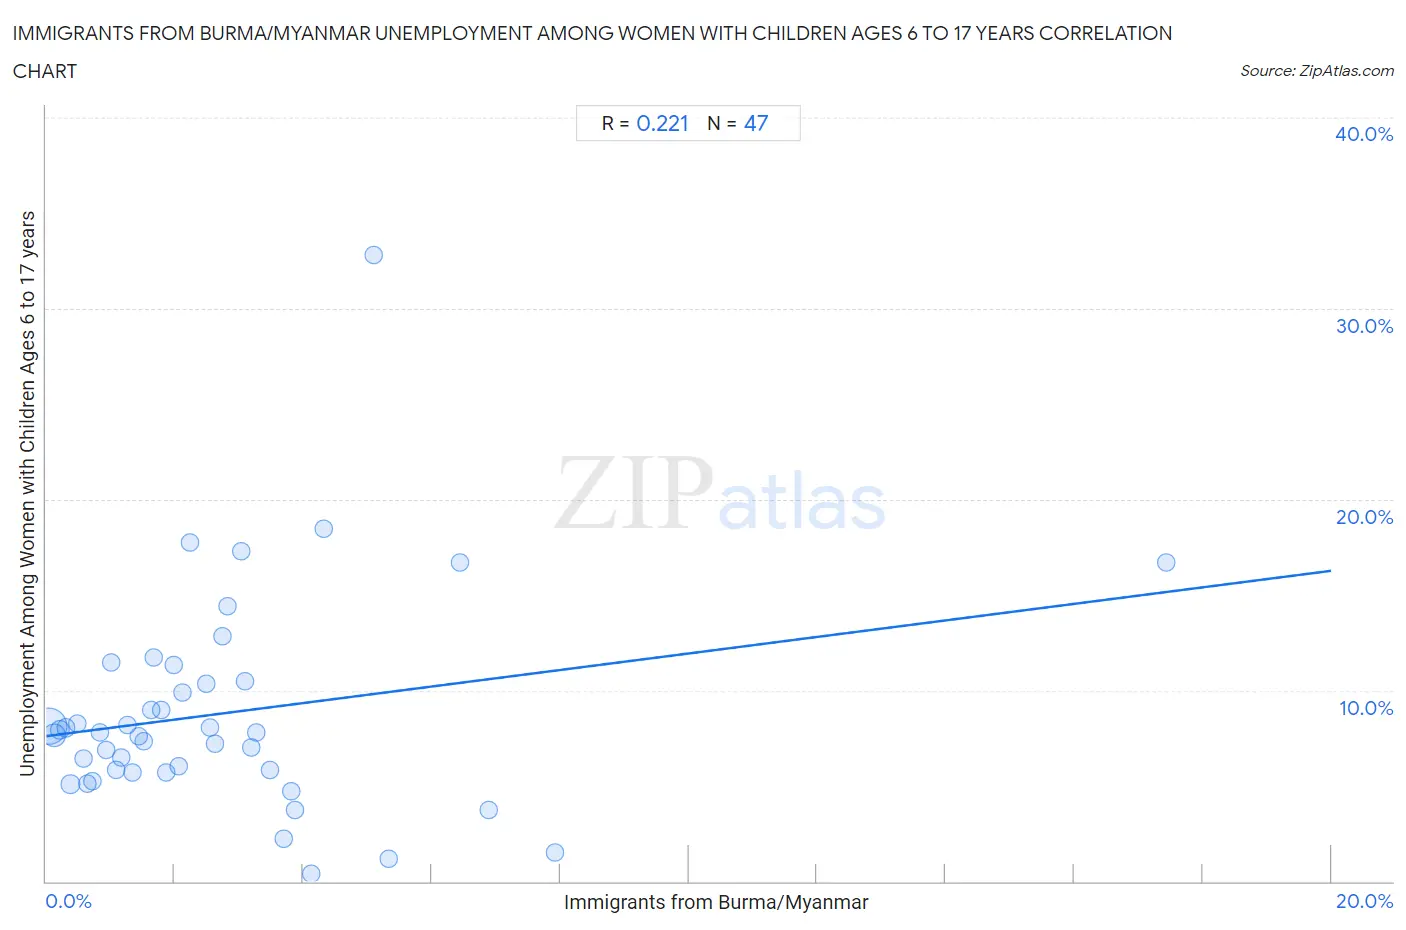
Immigrants from Burma/Myanmar Unemployment Among Women with Children Ages 6 to 17 years Correlation Chart
The statistical analysis conducted on geographies consisting of 144,257,995 people shows a weak positive correlation between the proportion of Immigrants from Burma/Myanmar and unemployment rate among women with children between the ages 6 and 17 in the United States with a correlation coefficient (R) of 0.221 and weighted average of 7.5%. On average, for every 1% (one percent) increase in Immigrants from Burma/Myanmar within a typical geography, there is an increase of 0.43% in unemployment rate among women with children between the ages 6 and 17.
It is essential to understand that the correlation between the percentage of Immigrants from Burma/Myanmar and unemployment rate among women with children between the ages 6 and 17 does not imply a direct cause-and-effect relationship. It remains uncertain whether the presence of Immigrants from Burma/Myanmar influences an upward or downward trend in the level of unemployment rate among women with children between the ages 6 and 17 within an area, or if Immigrants from Burma/Myanmar simply ended up residing in those areas with higher or lower levels of unemployment rate among women with children between the ages 6 and 17 due to other factors.
Demographics Similar to Immigrants from Burma/Myanmar by Unemployment Among Women with Children Ages 6 to 17 years
In terms of unemployment among women with children ages 6 to 17 years, the demographic groups most similar to Immigrants from Burma/Myanmar are Cambodian (7.5%, a difference of 0.18%), Puget Sound Salish (7.5%, a difference of 0.36%), Afghan (7.6%, a difference of 0.84%), Filipino (7.6%, a difference of 0.86%), and Sudanese (7.4%, a difference of 1.4%).
| Demographics | Rating | Rank | Unemployment Among Women with Children Ages 6 to 17 years |
| Assyrians/Chaldeans/Syriacs | 100.0 /100 | #9 | Exceptional 7.2% |
| Immigrants from Fiji | 100.0 /100 | #10 | Exceptional 7.3% |
| Immigrants from Taiwan | 100.0 /100 | #11 | Exceptional 7.3% |
| Bangladeshis | 100.0 /100 | #12 | Exceptional 7.4% |
| Indonesians | 100.0 /100 | #13 | Exceptional 7.4% |
| Sudanese | 100.0 /100 | #14 | Exceptional 7.4% |
| Puget Sound Salish | 100.0 /100 | #15 | Exceptional 7.5% |
| Immigrants from Burma/Myanmar | 100.0 /100 | #16 | Exceptional 7.5% |
| Cambodians | 100.0 /100 | #17 | Exceptional 7.5% |
| Afghans | 100.0 /100 | #18 | Exceptional 7.6% |
| Filipinos | 100.0 /100 | #19 | Exceptional 7.6% |
| Immigrants from Singapore | 100.0 /100 | #20 | Exceptional 7.7% |
| Immigrants from India | 100.0 /100 | #21 | Exceptional 7.7% |
| Immigrants from China | 100.0 /100 | #22 | Exceptional 7.7% |
| Immigrants from Indonesia | 100.0 /100 | #23 | Exceptional 7.7% |
Immigrants from Burma/Myanmar Unemployment Among Women with Children Ages 6 to 17 years Correlation Summary
| Measurement | Immigrants from Burma/Myanmar Data | Unemployment Among Women with Children Ages 6 to 17 years Data |
| Minimum | 0.038% | 0.40% |
| Maximum | 17.4% | 32.8% |
| Range | 17.4% | 32.4% |
| Mean | 2.7% | 8.8% |
| Median | 2.1% | 7.8% |
| Interquartile 25% (IQ1) | 1.0% | 5.7% |
| Interquartile 75% (IQ3) | 3.5% | 10.4% |
| Interquartile Range (IQR) | 2.5% | 4.7% |
| Standard Deviation (Sample) | 2.8% | 5.6% |
| Standard Deviation (Population) | 2.8% | 5.5% |
Correlation Details
| Immigrants from Burma/Myanmar Percentile | Sample Size | Unemployment Among Women with Children Ages 6 to 17 years |
[ 0.0% - 0.5% ] 0.038% | 96,502,248 | 8.1% |
[ 0.0% - 0.5% ] 0.12% | 22,261,224 | 7.6% |
[ 0.0% - 0.5% ] 0.22% | 8,083,949 | 7.9% |
[ 0.0% - 0.5% ] 0.30% | 3,142,465 | 8.0% |
[ 0.0% - 0.5% ] 0.38% | 2,093,718 | 5.1% |
[ 0.0% - 0.5% ] 0.48% | 1,815,653 | 8.3% |
[ 0.5% - 1.0% ] 0.58% | 2,031,823 | 6.4% |
[ 0.5% - 1.0% ] 0.64% | 1,145,701 | 5.1% |
[ 0.5% - 1.0% ] 0.73% | 836,058 | 5.2% |
[ 0.5% - 1.0% ] 0.84% | 892,145 | 7.8% |
[ 0.5% - 1.0% ] 0.92% | 465,276 | 6.9% |
[ 1.0% - 1.5% ] 1.01% | 332,000 | 11.5% |
[ 1.0% - 1.5% ] 1.08% | 1,177,901 | 5.8% |
[ 1.0% - 1.5% ] 1.17% | 188,218 | 6.5% |
[ 1.0% - 1.5% ] 1.26% | 287,947 | 8.2% |
[ 1.0% - 1.5% ] 1.34% | 220,066 | 5.7% |
[ 1.0% - 1.5% ] 1.44% | 322,996 | 7.6% |
[ 1.5% - 2.0% ] 1.51% | 279,170 | 7.3% |
[ 1.5% - 2.0% ] 1.63% | 340,808 | 9.0% |
[ 1.5% - 2.0% ] 1.67% | 110,463 | 11.7% |
[ 1.5% - 2.0% ] 1.80% | 118,978 | 9.0% |
[ 1.5% - 2.0% ] 1.86% | 414,913 | 5.7% |
[ 1.5% - 2.0% ] 1.99% | 5,968 | 11.3% |
[ 2.0% - 2.5% ] 2.06% | 256,522 | 6.0% |
[ 2.0% - 2.5% ] 2.13% | 34,455 | 9.9% |
[ 2.0% - 2.5% ] 2.23% | 36,256 | 17.7% |
[ 2.0% - 2.5% ] 2.48% | 52,403 | 10.4% |
[ 2.5% - 3.0% ] 2.55% | 122,537 | 8.0% |
[ 2.5% - 3.0% ] 2.63% | 45,550 | 7.2% |
[ 2.5% - 3.0% ] 2.75% | 78,420 | 12.8% |
[ 2.5% - 3.0% ] 2.81% | 14,212 | 14.4% |
[ 3.0% - 3.5% ] 3.03% | 24,684 | 17.3% |
[ 3.0% - 3.5% ] 3.10% | 94,089 | 10.4% |
[ 3.0% - 3.5% ] 3.20% | 20,135 | 7.0% |
[ 3.0% - 3.5% ] 3.27% | 31,976 | 7.8% |
[ 3.0% - 3.5% ] 3.48% | 31,715 | 5.8% |
[ 3.5% - 4.0% ] 3.70% | 23,980 | 2.2% |
[ 3.5% - 4.0% ] 3.81% | 57,662 | 4.7% |
[ 3.5% - 4.0% ] 3.88% | 15,899 | 3.7% |
[ 4.0% - 4.5% ] 4.12% | 25,699 | 0.40% |
[ 4.0% - 4.5% ] 4.31% | 81,015 | 18.5% |
[ 5.0% - 5.5% ] 5.11% | 5,268 | 32.8% |
[ 5.0% - 5.5% ] 5.33% | 37,834 | 1.2% |
[ 6.0% - 6.5% ] 6.45% | 19,501 | 16.7% |
[ 6.5% - 7.0% ] 6.88% | 19,613 | 3.7% |
[ 7.5% - 8.0% ] 7.92% | 56,794 | 1.5% |
[ 17.0% - 17.5% ] 17.43% | 2,088 | 16.7% |