Immigrants from Burma/Myanmar Single Mother Households
COMPARE
Immigrants from Burma/Myanmar
Select to Compare
Single Mother Households
Immigrants from Burma/Myanmar Single Mother Households
7.0%
SINGLE MOTHER HOUSEHOLDS
1.4/ 100
METRIC RATING
235th/ 347
METRIC RANK
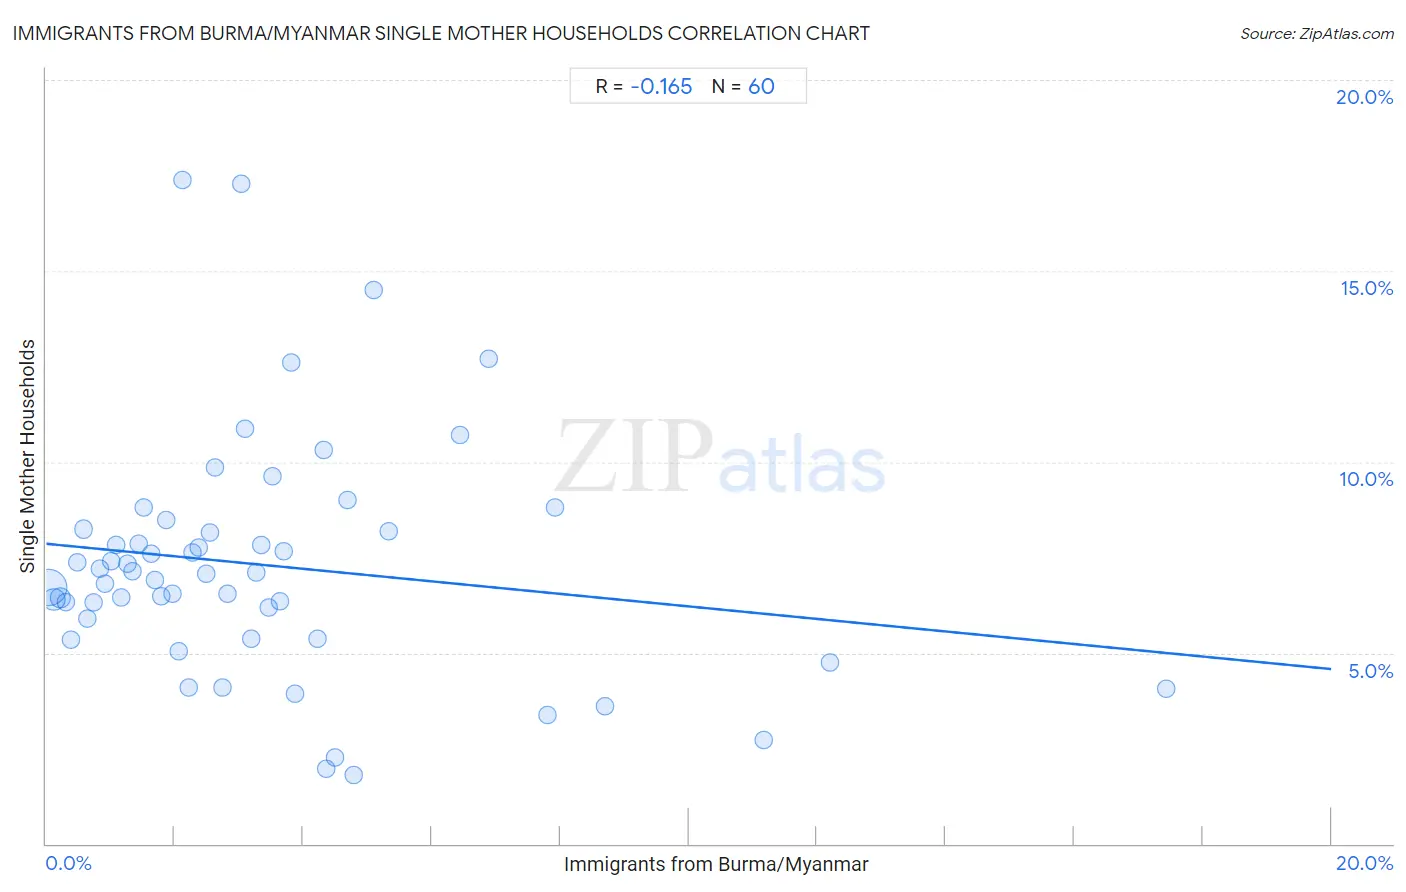
Immigrants from Burma/Myanmar Single Mother Households Correlation Chart
The statistical analysis conducted on geographies consisting of 172,110,214 people shows a poor negative correlation between the proportion of Immigrants from Burma/Myanmar and percentage of single mother households in the United States with a correlation coefficient (R) of -0.165 and weighted average of 7.0%. On average, for every 1% (one percent) increase in Immigrants from Burma/Myanmar within a typical geography, there is a decrease of 0.16% in percentage of single mother households.
It is essential to understand that the correlation between the percentage of Immigrants from Burma/Myanmar and percentage of single mother households does not imply a direct cause-and-effect relationship. It remains uncertain whether the presence of Immigrants from Burma/Myanmar influences an upward or downward trend in the level of percentage of single mother households within an area, or if Immigrants from Burma/Myanmar simply ended up residing in those areas with higher or lower levels of percentage of single mother households due to other factors.
Demographics Similar to Immigrants from Burma/Myanmar by Single Mother Households
In terms of single mother households, the demographic groups most similar to Immigrants from Burma/Myanmar are Chickasaw (7.0%, a difference of 0.070%), Choctaw (7.0%, a difference of 0.090%), Comanche (7.0%, a difference of 0.26%), Spanish American (7.0%, a difference of 0.32%), and Creek (7.0%, a difference of 0.34%).
| Demographics | Rating | Rank | Single Mother Households |
| Iroquois | 2.2 /100 | #228 | Tragic 7.0% |
| Immigrants from Kenya | 2.1 /100 | #229 | Tragic 7.0% |
| Creek | 1.6 /100 | #230 | Tragic 7.0% |
| Spanish Americans | 1.6 /100 | #231 | Tragic 7.0% |
| Comanche | 1.5 /100 | #232 | Tragic 7.0% |
| Choctaw | 1.4 /100 | #233 | Tragic 7.0% |
| Chickasaw | 1.4 /100 | #234 | Tragic 7.0% |
| Immigrants from Burma/Myanmar | 1.4 /100 | #235 | Tragic 7.0% |
| Ute | 1.0 /100 | #236 | Tragic 7.1% |
| Arapaho | 1.0 /100 | #237 | Tragic 7.1% |
| Panamanians | 0.9 /100 | #238 | Tragic 7.1% |
| Kiowa | 0.8 /100 | #239 | Tragic 7.1% |
| Immigrants from Panama | 0.7 /100 | #240 | Tragic 7.2% |
| Immigrants from Portugal | 0.6 /100 | #241 | Tragic 7.2% |
| Fijians | 0.6 /100 | #242 | Tragic 7.2% |
Immigrants from Burma/Myanmar Single Mother Households Correlation Summary
| Measurement | Immigrants from Burma/Myanmar Data | Single Mother Households Data |
| Minimum | 0.038% | 1.8% |
| Maximum | 17.4% | 17.4% |
| Range | 17.4% | 15.6% |
| Mean | 3.4% | 7.3% |
| Median | 2.6% | 7.1% |
| Interquartile 25% (IQ1) | 1.3% | 5.6% |
| Interquartile 75% (IQ3) | 4.3% | 8.2% |
| Interquartile Range (IQR) | 3.0% | 2.6% |
| Standard Deviation (Sample) | 3.2% | 3.1% |
| Standard Deviation (Population) | 3.1% | 3.1% |
Correlation Details
| Immigrants from Burma/Myanmar Percentile | Sample Size | Single Mother Households |
[ 0.0% - 0.5% ] 0.038% | 109,768,846 | 6.7% |
[ 0.0% - 0.5% ] 0.12% | 27,966,423 | 6.4% |
[ 0.0% - 0.5% ] 0.22% | 10,618,269 | 6.4% |
[ 0.0% - 0.5% ] 0.30% | 4,411,605 | 6.3% |
[ 0.0% - 0.5% ] 0.38% | 3,395,444 | 5.3% |
[ 0.0% - 0.5% ] 0.48% | 2,398,729 | 7.4% |
[ 0.5% - 1.0% ] 0.58% | 2,458,380 | 8.2% |
[ 0.5% - 1.0% ] 0.65% | 1,513,851 | 5.9% |
[ 0.5% - 1.0% ] 0.73% | 1,356,368 | 6.3% |
[ 0.5% - 1.0% ] 0.84% | 1,121,864 | 7.2% |
[ 0.5% - 1.0% ] 0.92% | 635,789 | 6.8% |
[ 1.0% - 1.5% ] 1.00% | 592,676 | 7.4% |
[ 1.0% - 1.5% ] 1.08% | 1,357,765 | 7.8% |
[ 1.0% - 1.5% ] 1.17% | 419,756 | 6.4% |
[ 1.0% - 1.5% ] 1.26% | 438,016 | 7.3% |
[ 1.0% - 1.5% ] 1.34% | 223,860 | 7.1% |
[ 1.0% - 1.5% ] 1.43% | 403,415 | 7.8% |
[ 1.5% - 2.0% ] 1.51% | 307,176 | 8.8% |
[ 1.5% - 2.0% ] 1.63% | 392,187 | 7.6% |
[ 1.5% - 2.0% ] 1.69% | 182,155 | 6.9% |
[ 1.5% - 2.0% ] 1.79% | 185,148 | 6.5% |
[ 1.5% - 2.0% ] 1.86% | 432,147 | 8.5% |
[ 1.5% - 2.0% ] 1.97% | 19,626 | 6.5% |
[ 2.0% - 2.5% ] 2.06% | 256,522 | 5.0% |
[ 2.0% - 2.5% ] 2.13% | 35,419 | 17.4% |
[ 2.0% - 2.5% ] 2.22% | 55,094 | 4.1% |
[ 2.0% - 2.5% ] 2.29% | 12,778 | 7.6% |
[ 2.0% - 2.5% ] 2.37% | 51,767 | 7.8% |
[ 2.0% - 2.5% ] 2.48% | 133,569 | 7.1% |
[ 2.5% - 3.0% ] 2.55% | 126,252 | 8.1% |
[ 2.5% - 3.0% ] 2.63% | 48,939 | 9.8% |
[ 2.5% - 3.0% ] 2.74% | 85,513 | 4.1% |
[ 2.5% - 3.0% ] 2.81% | 34,537 | 6.5% |
[ 3.0% - 3.5% ] 3.03% | 24,684 | 17.3% |
[ 3.0% - 3.5% ] 3.10% | 94,089 | 10.9% |
[ 3.0% - 3.5% ] 3.19% | 24,971 | 5.4% |
[ 3.0% - 3.5% ] 3.27% | 33,912 | 7.1% |
[ 3.0% - 3.5% ] 3.34% | 15,556 | 7.8% |
[ 3.0% - 3.5% ] 3.47% | 57,936 | 6.2% |
[ 3.5% - 4.0% ] 3.53% | 10,424 | 9.6% |
[ 3.5% - 4.0% ] 3.65% | 3,126 | 6.3% |
[ 3.5% - 4.0% ] 3.70% | 23,980 | 7.7% |
[ 3.5% - 4.0% ] 3.81% | 57,662 | 12.6% |
[ 3.5% - 4.0% ] 3.88% | 15,899 | 3.9% |
[ 4.0% - 4.5% ] 4.21% | 23,879 | 5.4% |
[ 4.0% - 4.5% ] 4.31% | 81,015 | 10.3% |
[ 4.0% - 4.5% ] 4.36% | 2,039 | 2.0% |
[ 4.0% - 4.5% ] 4.48% | 2,029 | 2.2% |
[ 4.5% - 5.0% ] 4.69% | 14,553 | 9.0% |
[ 4.5% - 5.0% ] 4.78% | 2,219 | 1.8% |
[ 5.0% - 5.5% ] 5.11% | 5,268 | 14.5% |
[ 5.0% - 5.5% ] 5.33% | 37,834 | 8.2% |
[ 6.0% - 6.5% ] 6.45% | 19,501 | 10.7% |
[ 6.5% - 7.0% ] 6.88% | 19,613 | 12.7% |
[ 7.5% - 8.0% ] 7.81% | 39,082 | 3.4% |
[ 7.5% - 8.0% ] 7.92% | 56,794 | 8.8% |
[ 8.5% - 9.0% ] 8.70% | 1,035 | 3.6% |
[ 11.0% - 11.5% ] 11.17% | 403 | 2.7% |
[ 12.0% - 12.5% ] 12.20% | 738 | 4.7% |
[ 17.0% - 17.5% ] 17.43% | 2,088 | 4.0% |