Portuguese 4 or more Vehicles in Household
COMPARE
Portuguese
Select to Compare
4 or more Vehicles in Household
Portuguese 4 or more Vehicles in Household
7.4%
4+ VEHICLES AVAILABLE
99.9/ 100
METRIC RATING
73rd/ 347
METRIC RANK
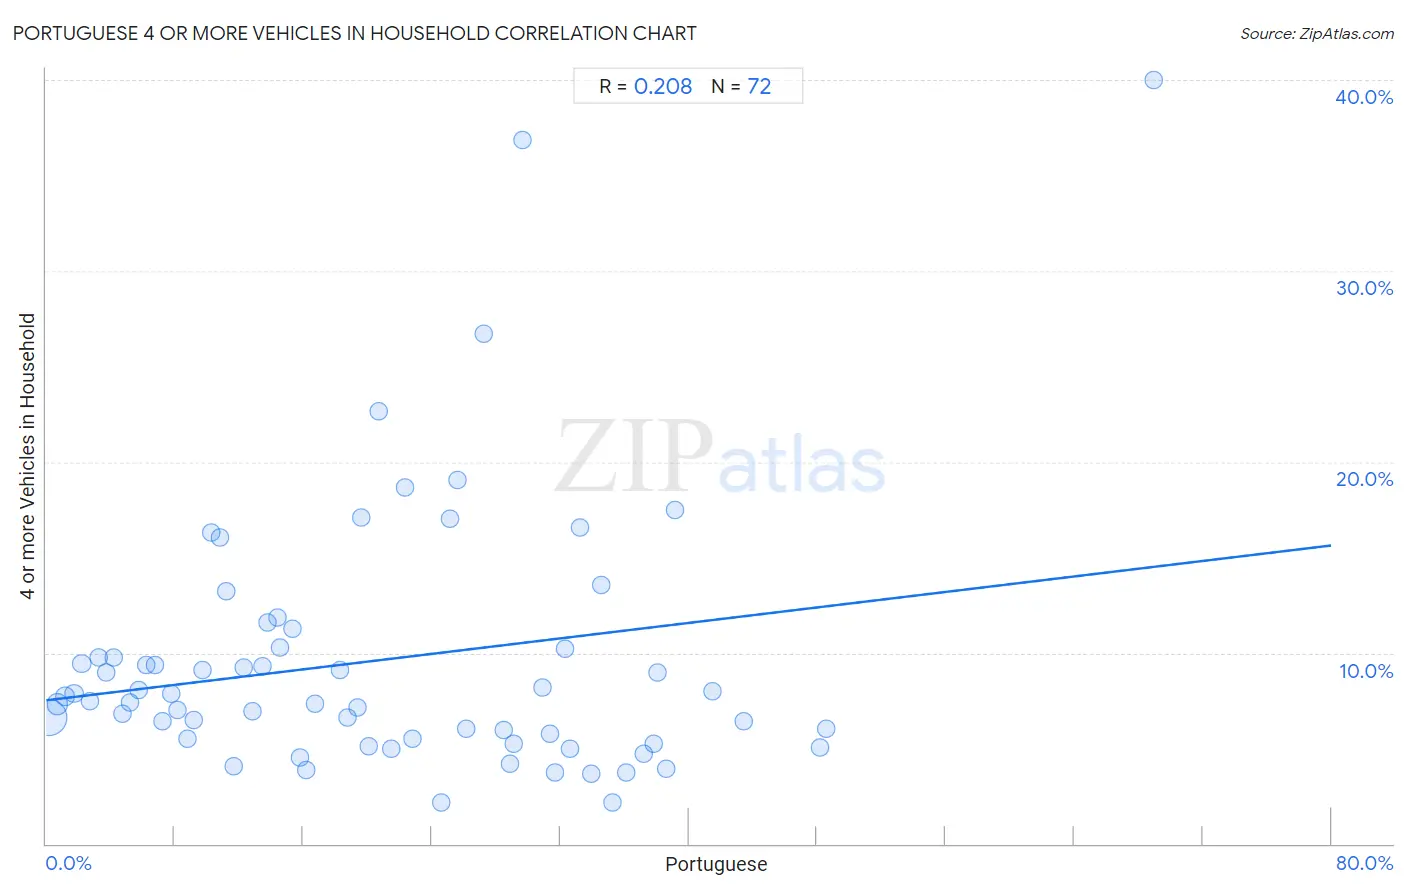
Portuguese 4 or more Vehicles in Household Correlation Chart
The statistical analysis conducted on geographies consisting of 448,080,831 people shows a weak positive correlation between the proportion of Portuguese and percentage of households with 4 or more vehicles available in the United States with a correlation coefficient (R) of 0.208 and weighted average of 7.4%. On average, for every 1% (one percent) increase in Portuguese within a typical geography, there is an increase of 0.10% in percentage of households with 4 or more vehicles available.
It is essential to understand that the correlation between the percentage of Portuguese and percentage of households with 4 or more vehicles available does not imply a direct cause-and-effect relationship. It remains uncertain whether the presence of Portuguese influences an upward or downward trend in the level of percentage of households with 4 or more vehicles available within an area, or if Portuguese simply ended up residing in those areas with higher or lower levels of percentage of households with 4 or more vehicles available due to other factors.
Demographics Similar to Portuguese by 4 or more Vehicles in Household
In terms of 4 or more vehicles in household, the demographic groups most similar to Portuguese are Scotch-Irish (7.4%, a difference of 0.090%), Icelander (7.4%, a difference of 0.30%), Immigrants from Cambodia (7.4%, a difference of 0.31%), Laotian (7.4%, a difference of 0.36%), and Chickasaw (7.4%, a difference of 0.39%).
| Demographics | Rating | Rank | 4 or more Vehicles in Household |
| Immigrants from Taiwan | 99.9 /100 | #66 | Exceptional 7.5% |
| Americans | 99.9 /100 | #67 | Exceptional 7.5% |
| Welsh | 99.9 /100 | #68 | Exceptional 7.5% |
| Germans | 99.9 /100 | #69 | Exceptional 7.5% |
| Scottish | 99.9 /100 | #70 | Exceptional 7.4% |
| Chickasaw | 99.9 /100 | #71 | Exceptional 7.4% |
| Scotch-Irish | 99.9 /100 | #72 | Exceptional 7.4% |
| Portuguese | 99.9 /100 | #73 | Exceptional 7.4% |
| Icelanders | 99.9 /100 | #74 | Exceptional 7.4% |
| Immigrants from Cambodia | 99.9 /100 | #75 | Exceptional 7.4% |
| Laotians | 99.9 /100 | #76 | Exceptional 7.4% |
| Apache | 99.9 /100 | #77 | Exceptional 7.4% |
| Whites/Caucasians | 99.8 /100 | #78 | Exceptional 7.4% |
| Czechs | 99.8 /100 | #79 | Exceptional 7.4% |
| Alaska Natives | 99.8 /100 | #80 | Exceptional 7.3% |
Portuguese 4 or more Vehicles in Household Correlation Summary
| Measurement | Portuguese Data | 4 or more Vehicles in Household Data |
| Minimum | 0.18% | 2.1% |
| Maximum | 68.9% | 40.0% |
| Range | 68.8% | 37.9% |
| Mean | 20.7% | 9.6% |
| Median | 19.0% | 7.6% |
| Interquartile 25% (IQ1) | 9.0% | 5.5% |
| Interquartile 75% (IQ3) | 31.5% | 10.2% |
| Interquartile Range (IQR) | 22.5% | 4.8% |
| Standard Deviation (Sample) | 14.2% | 6.9% |
| Standard Deviation (Population) | 14.1% | 6.8% |
Correlation Details
| Portuguese Percentile | Sample Size | 4 or more Vehicles in Household |
[ 0.0% - 0.5% ] 0.18% | 346,825,625 | 6.6% |
[ 0.5% - 1.0% ] 0.70% | 53,299,142 | 7.3% |
[ 1.0% - 1.5% ] 1.20% | 19,604,597 | 7.7% |
[ 1.5% - 2.0% ] 1.72% | 10,037,772 | 7.9% |
[ 2.0% - 2.5% ] 2.22% | 5,451,105 | 9.4% |
[ 2.5% - 3.0% ] 2.74% | 2,789,639 | 7.5% |
[ 3.0% - 3.5% ] 3.25% | 2,395,811 | 9.7% |
[ 3.5% - 4.0% ] 3.73% | 1,387,331 | 9.0% |
[ 4.0% - 4.5% ] 4.21% | 719,064 | 9.8% |
[ 4.5% - 5.0% ] 4.74% | 844,156 | 6.8% |
[ 5.0% - 5.5% ] 5.22% | 670,346 | 7.4% |
[ 5.5% - 6.0% ] 5.74% | 751,504 | 8.1% |
[ 6.0% - 6.5% ] 6.21% | 423,172 | 9.4% |
[ 6.5% - 7.0% ] 6.78% | 389,380 | 9.3% |
[ 7.0% - 7.5% ] 7.22% | 254,982 | 6.4% |
[ 7.5% - 8.0% ] 7.81% | 361,823 | 7.8% |
[ 8.0% - 8.5% ] 8.19% | 119,319 | 7.0% |
[ 8.5% - 9.0% ] 8.83% | 141,761 | 5.5% |
[ 9.0% - 9.5% ] 9.17% | 142,260 | 6.5% |
[ 9.5% - 10.0% ] 9.75% | 140,694 | 9.1% |
[ 10.0% - 10.5% ] 10.30% | 14,976 | 16.3% |
[ 10.5% - 11.0% ] 10.79% | 61,532 | 16.0% |
[ 11.0% - 11.5% ] 11.22% | 71,456 | 13.2% |
[ 11.5% - 12.0% ] 11.70% | 125,289 | 4.0% |
[ 12.0% - 12.5% ] 12.31% | 20,452 | 9.2% |
[ 12.5% - 13.0% ] 12.85% | 33,076 | 6.9% |
[ 13.0% - 13.5% ] 13.44% | 18,931 | 9.3% |
[ 13.5% - 14.0% ] 13.76% | 25,180 | 11.6% |
[ 14.0% - 14.5% ] 14.37% | 6,401 | 11.8% |
[ 14.5% - 15.0% ] 14.57% | 2,821 | 10.3% |
[ 15.0% - 15.5% ] 15.34% | 7,127 | 11.3% |
[ 15.5% - 16.0% ] 15.81% | 6,080 | 4.5% |
[ 16.0% - 16.5% ] 16.19% | 9,009 | 3.9% |
[ 16.5% - 17.0% ] 16.74% | 19,376 | 7.3% |
[ 18.0% - 18.5% ] 18.26% | 40,467 | 9.1% |
[ 18.5% - 19.0% ] 18.73% | 82,595 | 6.6% |
[ 19.0% - 19.5% ] 19.35% | 53,635 | 7.2% |
[ 19.5% - 20.0% ] 19.59% | 5,231 | 17.1% |
[ 20.0% - 20.5% ] 20.04% | 6,511 | 5.1% |
[ 20.5% - 21.0% ] 20.72% | 1,699 | 22.6% |
[ 21.0% - 21.5% ] 21.48% | 20,883 | 5.0% |
[ 22.0% - 22.5% ] 22.36% | 13,232 | 18.7% |
[ 22.5% - 23.0% ] 22.84% | 52,833 | 5.5% |
[ 24.5% - 25.0% ] 24.56% | 16,286 | 2.2% |
[ 25.0% - 25.5% ] 25.16% | 4,463 | 17.0% |
[ 25.5% - 26.0% ] 25.59% | 1,399 | 19.0% |
[ 26.0% - 26.5% ] 26.17% | 10,792 | 6.0% |
[ 27.0% - 27.5% ] 27.22% | 6,768 | 26.7% |
[ 28.0% - 28.5% ] 28.50% | 11,117 | 5.9% |
[ 28.5% - 29.0% ] 28.88% | 62,947 | 4.2% |
[ 29.0% - 29.5% ] 29.14% | 21,742 | 5.2% |
[ 29.5% - 30.0% ] 29.63% | 54 | 36.8% |
[ 30.5% - 31.0% ] 30.91% | 495 | 8.2% |
[ 31.0% - 31.5% ] 31.35% | 50,072 | 5.8% |
[ 31.5% - 32.0% ] 31.65% | 18,810 | 3.7% |
[ 32.0% - 32.5% ] 32.30% | 10,466 | 10.2% |
[ 32.5% - 33.0% ] 32.62% | 120,280 | 5.0% |
[ 33.0% - 33.5% ] 33.21% | 8,763 | 16.6% |
[ 33.5% - 34.0% ] 33.89% | 15,629 | 3.6% |
[ 34.5% - 35.0% ] 34.52% | 8,403 | 13.5% |
[ 35.0% - 35.5% ] 35.22% | 17,164 | 2.1% |
[ 36.0% - 36.5% ] 36.09% | 93,789 | 3.7% |
[ 37.0% - 37.5% ] 37.20% | 43,238 | 4.7% |
[ 37.5% - 38.0% ] 37.83% | 30,558 | 5.2% |
[ 38.0% - 38.5% ] 38.05% | 21,383 | 8.9% |
[ 38.5% - 39.0% ] 38.59% | 4,556 | 3.9% |
[ 39.0% - 39.5% ] 39.14% | 6,484 | 17.5% |
[ 41.0% - 41.5% ] 41.44% | 11,431 | 8.0% |
[ 43.0% - 43.5% ] 43.45% | 25,084 | 6.4% |
[ 48.0% - 48.5% ] 48.18% | 4,660 | 5.0% |
[ 48.5% - 49.0% ] 48.56% | 5,591 | 6.0% |
[ 68.5% - 69.0% ] 68.94% | 132 | 40.0% |