Immigrants from Kenya 4 or more Vehicles in Household

COMPARE

Immigrants from Kenya
Race
Ancestry
AfghanAfricanAlaska NativeAlaskan AthabascanAlbanianAleutAlsatianAmericanApacheArabArapahoArgentineanArmenianAssyrian/Chaldean/SyriacAustralianAustrianBahamianBangladeshiBarbadianBasqueBelgianBelizeanBermudanBhutaneseBlackfeetBolivianBrazilianBritishBritish West IndianBulgarianBurmeseCajunCambodianCanadianCape VerdeanCarpatho RusynCelticCentral AmericanCentral American IndianCherokeeCheyenneChickasawChileanChineseChippewaChoctawColombianColvilleComancheCosta RicanCreeCreekCroatianCrowCubanCypriotCzechCzechoslovakianDanishDelawareDominicanDutchDutch West IndianEastern EuropeanEcuadorianEgyptianEnglishEstonianEthiopianEuropeanFijianFilipinoFinnishFrenchFrench American IndianFrench CanadianGermanGerman RussianGhanaianGreekGuamanian/ChamorroGuatemalanGuyaneseHaitianHmongHonduranHopiHoumaHungarianIcelanderIndian (Asian)IndonesianInupiatIranianIraqiIrishIroquoisIsraeliItalianJamaicanJapaneseJordanianKenyanKiowaKoreanLaotianLatvianLebaneseLiberianLithuanianLumbeeLuxembourgerMacedonianMalaysianMalteseMarshalleseMenomineeMexicanMexican American IndianMongolianMoroccanNative HawaiianNavajoNepaleseNew ZealanderNicaraguanNigerianNorthern EuropeanNorwegianOkinawanOsageOttawaPaiutePakistaniPalestinianPanamanianParaguayanPennsylvania GermanPeruvianPimaPolishPortuguesePotawatomiPuebloPuerto RicanPuget Sound SalishRomanianRussianSalvadoranSamoanScandinavianScotch-IrishScottishSeminoleSenegaleseSerbianShoshoneSierra LeoneanSiouxSlavicSlovakSloveneSomaliSouth AfricanSouth AmericanSouth American IndianSoviet UnionSpaniardSpanishSpanish AmericanSpanish American IndianSri LankanSubsaharan AfricanSudaneseSwedishSwissSyrianTaiwaneseThaiTlingit-HaidaTohono O'OdhamTonganTrinidadian and TobagonianTsimshianTurkishU.S. Virgin IslanderUgandanUkrainianUruguayanUteVenezuelanVietnameseWelshWest IndianYakamaYaquiYugoslavianYumanYup'ikZimbabwean
Immigration
NonimmigrantsImmigrantsAfghanistanAfricaAlbaniaArgentinaArmeniaAsiaAustraliaAustriaBahamasBangladeshBarbadosBelarusBelgiumBelizeBoliviaBosnia and HerzegovinaBrazilBulgariaBurma/MyanmarCabo VerdeCambodiaCameroonCanadaCaribbeanCentral AmericaChileChinaColombiaCongoCosta RicaCroatiaCubaCzechoslovakiaDenmarkDominicaDominican RepublicEastern AfricaEastern AsiaEastern EuropeEcuadorEgyptEl SalvadorEnglandEritreaEthiopiaEuropeFijiFranceGermanyGhanaGreeceGrenadaGuatemalaGuyanaHaitiHondurasHong KongHungaryIndiaIndonesiaIranIraqIrelandIsraelItalyJamaicaJapanJordanKazakhstanKenyaKoreaKuwaitLaosLatin AmericaLatviaLebanonLiberiaLithuaniaMalaysiaMexicoMicronesiaMiddle AfricaMoldovaMoroccoNepalNetherlandsNicaraguaNigeriaNorth AmericaNorth MacedoniaNorthern AfricaNorthern EuropeNorwayOceaniaPakistanPanamaPeruPhilippinesPolandPortugalRomaniaRussiaSaudi ArabiaScotlandSenegalSerbiaSierra LeoneSingaporeSomaliaSouth AfricaSouth AmericaSouth Central AsiaSouth Eastern AsiaSouthern EuropeSpainSri LankaSt. Vincent and the GrenadinesSudanSwedenSwitzerlandSyriaTaiwanThailandTrinidad and TobagoTurkeyUgandaUkraineUruguayUzbekistanVenezuelaVietnamWest IndiesWestern AfricaWestern AsiaWestern EuropeYemenZaireZimbabweAzores
Select to Compare
Race
Ancestry
AfghanAfricanAlaska NativeAlaskan AthabascanAlbanianAleutAlsatianAmericanApacheArabArapahoArgentineanArmenianAssyrian/Chaldean/SyriacAustralianAustrianBahamianBangladeshiBarbadianBasqueBelgianBelizeanBermudanBhutaneseBlackfeetBolivianBrazilianBritishBritish West IndianBulgarianBurmeseCajunCambodianCanadianCape VerdeanCarpatho RusynCelticCentral AmericanCentral American IndianCherokeeCheyenneChickasawChileanChineseChippewaChoctawColombianColvilleComancheCosta RicanCreeCreekCroatianCrowCubanCypriotCzechCzechoslovakianDanishDelawareDominicanDutchDutch West IndianEastern EuropeanEcuadorianEgyptianEnglishEstonianEthiopianEuropeanFijianFilipinoFinnishFrenchFrench American IndianFrench CanadianGermanGerman RussianGhanaianGreekGuamanian/ChamorroGuatemalanGuyaneseHaitianHmongHonduranHopiHoumaHungarianIcelanderIndian (Asian)IndonesianInupiatIranianIraqiIrishIroquoisIsraeliItalianJamaicanJapaneseJordanianKenyanKiowaKoreanLaotianLatvianLebaneseLiberianLithuanianLumbeeLuxembourgerMacedonianMalaysianMalteseMarshalleseMenomineeMexicanMexican American IndianMongolianMoroccanNative HawaiianNavajoNepaleseNew ZealanderNicaraguanNigerianNorthern EuropeanNorwegianOkinawanOsageOttawaPaiutePakistaniPalestinianPanamanianParaguayanPennsylvania GermanPeruvianPimaPolishPortuguesePotawatomiPuebloPuerto RicanPuget Sound SalishRomanianRussianSalvadoranSamoanScandinavianScotch-IrishScottishSeminoleSenegaleseSerbianShoshoneSierra LeoneanSiouxSlavicSlovakSloveneSomaliSouth AfricanSouth AmericanSouth American IndianSoviet UnionSpaniardSpanishSpanish AmericanSpanish American IndianSri LankanSubsaharan AfricanSudaneseSwedishSwissSyrianTaiwaneseThaiTlingit-HaidaTohono O'OdhamTonganTrinidadian and TobagonianTsimshianTurkishU.S. Virgin IslanderUgandanUkrainianUruguayanUteVenezuelanVietnameseWelshWest IndianYakamaYaquiYugoslavianYumanYup'ikZimbabwean
Immigration
NonimmigrantsImmigrantsAfghanistanAfricaAlbaniaArgentinaArmeniaAsiaAustraliaAustriaBahamasBangladeshBarbadosBelarusBelgiumBelizeBoliviaBosnia and HerzegovinaBrazilBulgariaBurma/MyanmarCabo VerdeCambodiaCameroonCanadaCaribbeanCentral AmericaChileChinaColombiaCongoCosta RicaCroatiaCubaCzechoslovakiaDenmarkDominicaDominican RepublicEastern AfricaEastern AsiaEastern EuropeEcuadorEgyptEl SalvadorEnglandEritreaEthiopiaEuropeFijiFranceGermanyGhanaGreeceGrenadaGuatemalaGuyanaHaitiHondurasHong KongHungaryIndiaIndonesiaIranIraqIrelandIsraelItalyJamaicaJapanJordanKazakhstanKoreaKuwaitLaosLatin AmericaLatviaLebanonLiberiaLithuaniaMalaysiaMexicoMicronesiaMiddle AfricaMoldovaMoroccoNepalNetherlandsNicaraguaNigeriaNorth AmericaNorth MacedoniaNorthern AfricaNorthern EuropeNorwayOceaniaPakistanPanamaPeruPhilippinesPolandPortugalRomaniaRussiaSaudi ArabiaScotlandSenegalSerbiaSierra LeoneSingaporeSomaliaSouth AfricaSouth AmericaSouth Central AsiaSouth Eastern AsiaSouthern EuropeSpainSri LankaSt. Vincent and the GrenadinesSudanSwedenSwitzerlandSyriaTaiwanThailandTrinidad and TobagoTurkeyUgandaUkraineUruguayUzbekistanVenezuelaVietnamWest IndiesWestern AfricaWestern AsiaWestern EuropeYemenZaireZimbabweAzores
4 or more Vehicles in Household
Income
Poverty
Unemployment
Labor Participation
Family Structure
Vehicle Availability
Education Level
Disability

Immigrants from Kenya 4 or more Vehicles in Household
Tragic

6.0%
4+ VEHICLES AVAILABLE
9.2/ 100
METRIC RATING
223rd/ 347
METRIC RANK

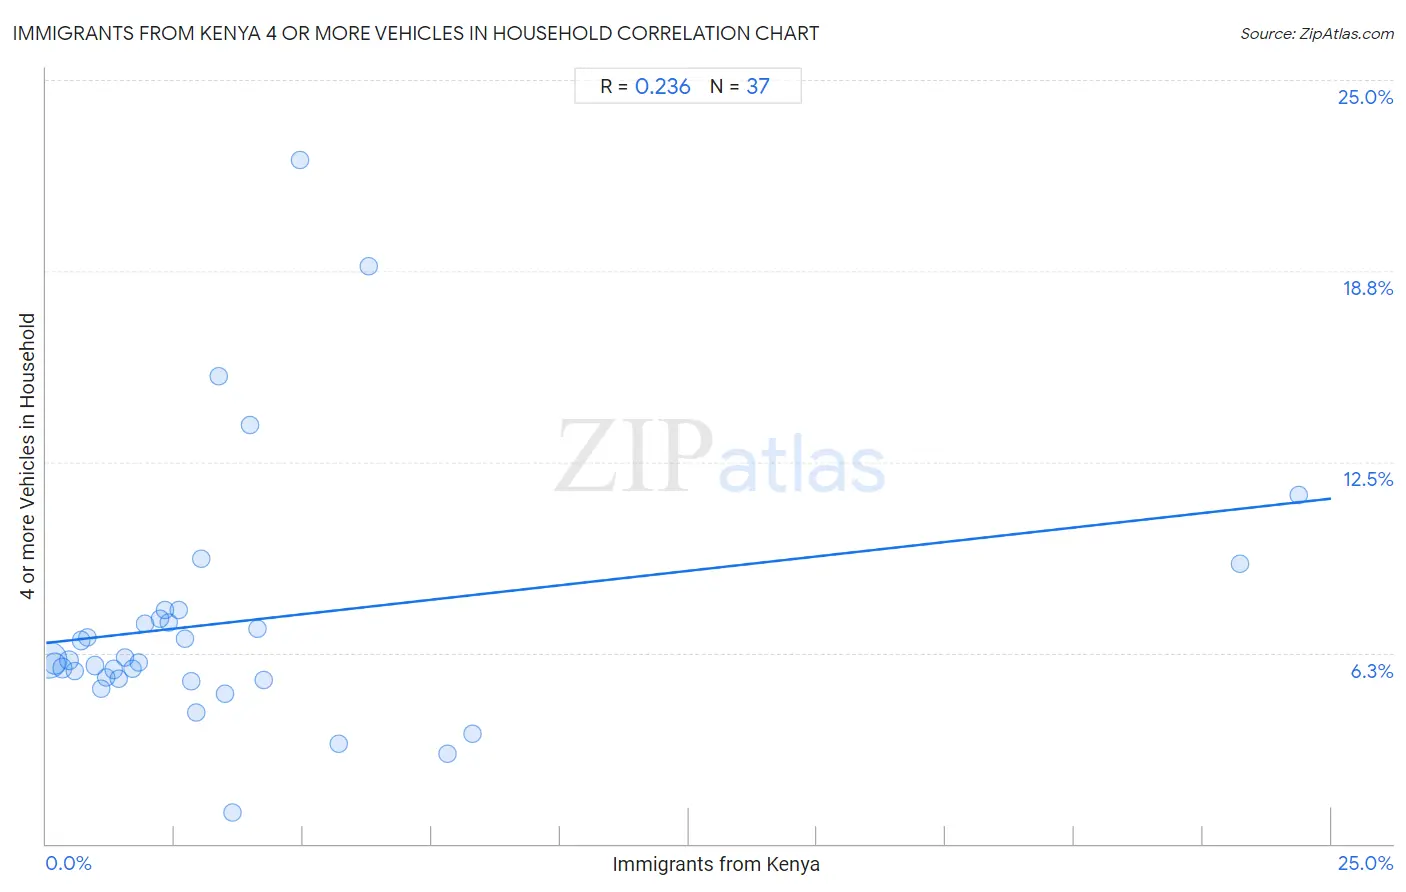
Immigrants from Kenya 4 or more Vehicles in Household Correlation Chart

The statistical analysis conducted on geographies consisting of 217,337,242 people shows a weak positive correlation between the proportion of Immigrants from Kenya and percentage of households with 4 or more vehicles available in the United States with a correlation coefficient (R) of 0.236 and weighted average of 6.0%. On average, for every 1% (one percent) increase in Immigrants from Kenya within a typical geography, there is an increase of 0.19% in percentage of households with 4 or more vehicles available.
Immigrants from Kenya 4 or more Vehicles in Household
It is essential to understand that the correlation between the percentage of Immigrants from Kenya and percentage of households with 4 or more vehicles available does not imply a direct cause-and-effect relationship. It remains uncertain whether the presence of Immigrants from Kenya influences an upward or downward trend in the level of percentage of households with 4 or more vehicles available within an area, or if Immigrants from Kenya simply ended up residing in those areas with higher or lower levels of percentage of households with 4 or more vehicles available due to other factors.

Demographics Similar to Immigrants from Kenya by 4 or more Vehicles in Household

In terms of 4 or more vehicles in household, the demographic groups most similar to Immigrants from Kenya are Cajun (6.0%, a difference of 0.0%), Cuban (6.0%, a difference of 0.010%), Immigrants from Moldova (6.0%, a difference of 0.030%), Indonesian (6.0%, a difference of 0.090%), and Russian (6.0%, a difference of 0.33%).
DemographicsRating | Rank4 or more Vehicles in Household
Immigrants from Romania
13.8
/100
|
#216
Poor
6.0%
Nigerians
12.2
/100
|
#217
Poor
6.0%
Immigrants from Italy
11.0
/100
|
#218
Poor
6.0%
Serbians
11.0
/100
|
#219
Poor
6.0%
Russians
10.3
/100
|
#220
Poor
6.0%
Immigrants from Moldova
9.3
/100
|
#221
Tragic
6.0%
Cajuns
9.2
/100
|
#222
Tragic
6.0%
Immigrants from Kenya
9.2
/100
|
#223
Tragic
6.0%
Cubans
9.2
/100
|
#224
Tragic
6.0%
Indonesians
8.9
/100
|
#225
Tragic
6.0%
Immigrants from Singapore
7.9
/100
|
#226
Tragic
5.9%
Immigrants from Western Asia
7.8
/100
|
#227
Tragic
5.9%
Immigrants from Uganda
7.5
/100
|
#228
Tragic
5.9%
Eastern Europeans
6.8
/100
|
#229
Tragic
5.9%
Immigrants from Malaysia
6.7
/100
|
#230
Tragic
5.9%

Immigrants from Kenya 4 or more Vehicles in Household Correlation Summary

MeasurementImmigrants from Kenya Data4 or more Vehicles in Household Data
Minimum0.045%1.0%
Maximum24.4%22.4%
Range24.3%21.3%
Mean3.8%7.3%
Median2.4%6.0%
Interquartile 25% (IQ1)1.1%5.4%
Interquartile 75% (IQ3)4.0%7.5%
Interquartile Range (IQR)2.9%2.1%
Standard Deviation (Sample)5.2%4.2%
Standard Deviation (Population)5.2%4.1%

Correlation Details

Immigrants from Kenya PercentileSample Size4 or more Vehicles in Household
[
0.0%
-
0.5%
]
0.045%
154,301,1056.0%
[
0.0%
-
0.5%
]
0.17%
33,039,0375.9%
[
0.0%
-
0.5%
]
0.31%
12,049,4285.8%
[
0.0%
-
0.5%
]
0.44%
6,459,9926.0%
[
0.5%
-
1.0%
]
0.56%
3,961,5575.6%
[
0.5%
-
1.0%
]
0.67%
1,869,1636.7%
[
0.5%
-
1.0%
]
0.79%
1,461,2486.7%
[
0.5%
-
1.0%
]
0.94%
977,4565.8%
[
1.0%
-
1.5%
]
1.06%
805,9695.1%
[
1.0%
-
1.5%
]
1.16%
571,1295.4%
[
1.0%
-
1.5%
]
1.30%
387,4485.7%
[
1.0%
-
1.5%
]
1.42%
301,2615.4%
[
1.5%
-
2.0%
]
1.53%
261,8996.1%
[
1.5%
-
2.0%
]
1.68%
109,7785.7%
[
1.5%
-
2.0%
]
1.79%
229,6335.9%
[
1.5%
-
2.0%
]
1.92%
113,7207.2%
[
2.0%
-
2.5%
]
2.20%
191,1207.4%
[
2.0%
-
2.5%
]
2.30%
9,1717.7%
[
2.0%
-
2.5%
]
2.39%
50,7587.2%
[
2.5%
-
3.0%
]
2.58%
27,2907.7%
[
2.5%
-
3.0%
]
2.70%
16,0866.7%
[
2.5%
-
3.0%
]
2.82%
61,5785.3%
[
2.5%
-
3.0%
]
2.93%
16,8844.3%
[
3.0%
-
3.5%
]
3.02%
16,3189.3%
[
3.0%
-
3.5%
]
3.36%
2,61815.3%
[
3.0%
-
3.5%
]
3.48%
2,1544.9%
[
3.5%
-
4.0%
]
3.62%
8,8921.0%
[
3.5%
-
4.0%
]
3.96%
22713.7%
[
4.0%
-
4.5%
]
4.10%
2,4647.0%
[
4.0%
-
4.5%
]
4.23%
24,0085.4%
[
4.5%
-
5.0%
]
4.94%
32422.4%
[
5.5%
-
6.0%
]
5.68%
3,8383.3%
[
6.0%
-
6.5%
]
6.27%
1,40318.9%
[
7.5%
-
8.0%
]
7.80%
4232.9%
[
8.0%
-
8.5%
]
8.30%
1,1573.6%
[
23.0%
-
23.5%
]
23.22%
2679.2%
[
24.0%
-
24.5%
]
24.37%
43911.4%