Turkish 4 or more Vehicles in Household
COMPARE
Turkish
Select to Compare
4 or more Vehicles in Household
Turkish 4 or more Vehicles in Household
5.8%
4+ VEHICLES AVAILABLE
4.1/ 100
METRIC RATING
237th/ 347
METRIC RANK
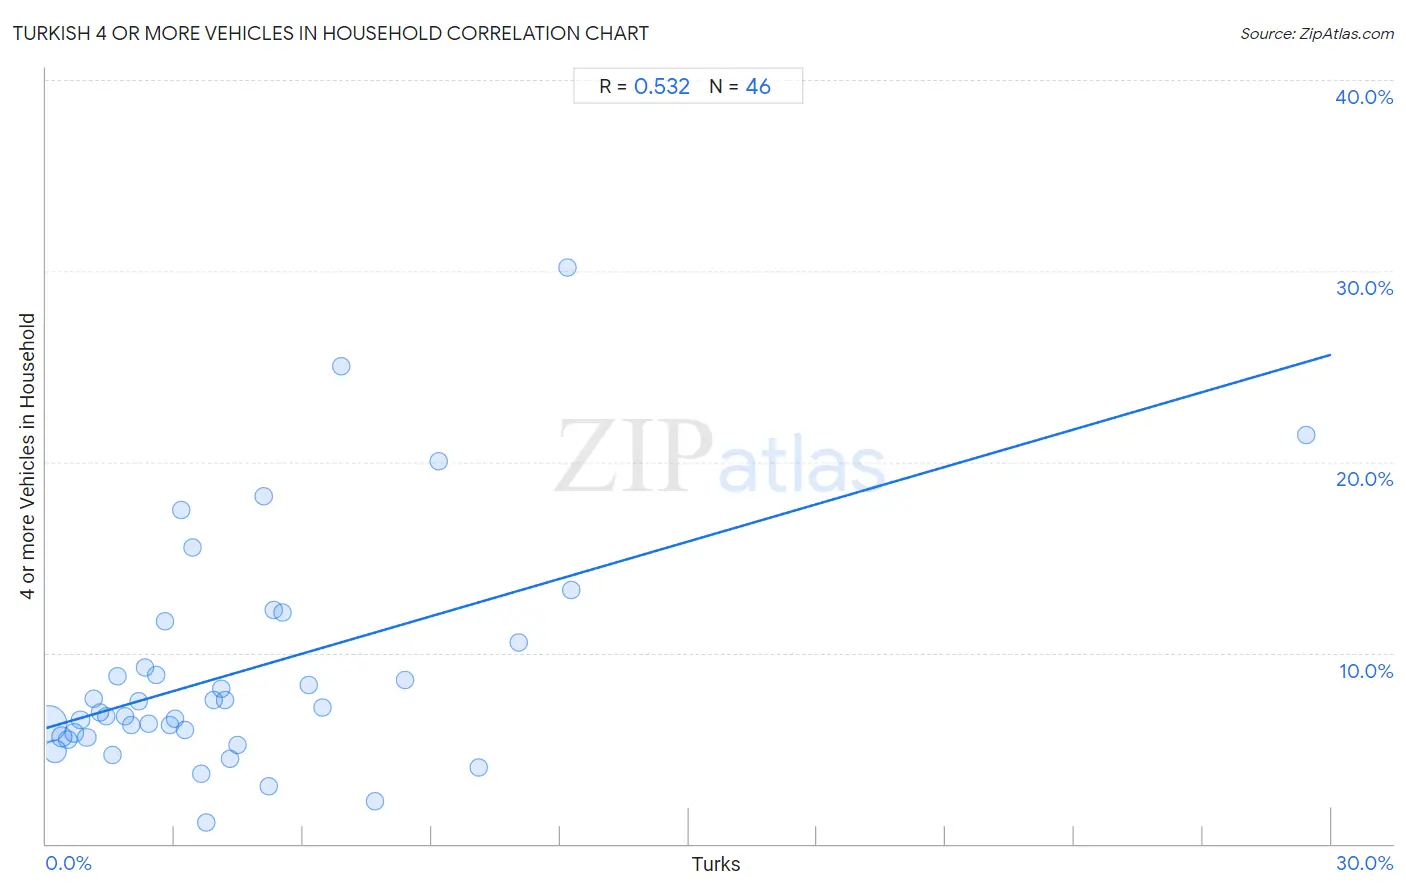
Turkish 4 or more Vehicles in Household Correlation Chart
The statistical analysis conducted on geographies consisting of 270,554,311 people shows a substantial positive correlation between the proportion of Turks and percentage of households with 4 or more vehicles available in the United States with a correlation coefficient (R) of 0.532 and weighted average of 5.8%. On average, for every 1% (one percent) increase in Turks within a typical geography, there is an increase of 0.65% in percentage of households with 4 or more vehicles available.
It is essential to understand that the correlation between the percentage of Turks and percentage of households with 4 or more vehicles available does not imply a direct cause-and-effect relationship. It remains uncertain whether the presence of Turks influences an upward or downward trend in the level of percentage of households with 4 or more vehicles available within an area, or if Turks simply ended up residing in those areas with higher or lower levels of percentage of households with 4 or more vehicles available due to other factors.
Demographics Similar to Turks by 4 or more Vehicles in Household
In terms of 4 or more vehicles in household, the demographic groups most similar to Turks are Immigrants from Belgium (5.8%, a difference of 0.13%), Immigrants from Australia (5.8%, a difference of 0.22%), Immigrants from Poland (5.8%, a difference of 0.26%), Immigrants from Eritrea (5.8%, a difference of 0.27%), and Immigrants from Hungary (5.8%, a difference of 0.29%).
| Demographics | Rating | Rank | 4 or more Vehicles in Household |
| Immigrants from Malaysia | 6.7 /100 | #230 | Tragic 5.9% |
| Immigrants from Switzerland | 6.4 /100 | #231 | Tragic 5.9% |
| Immigrants from Argentina | 6.0 /100 | #232 | Tragic 5.9% |
| Sierra Leoneans | 6.0 /100 | #233 | Tragic 5.9% |
| Africans | 4.6 /100 | #234 | Tragic 5.8% |
| Immigrants from Hungary | 4.6 /100 | #235 | Tragic 5.8% |
| Immigrants from Eritrea | 4.5 /100 | #236 | Tragic 5.8% |
| Turks | 4.1 /100 | #237 | Tragic 5.8% |
| Immigrants from Belgium | 4.0 /100 | #238 | Tragic 5.8% |
| Immigrants from Australia | 3.8 /100 | #239 | Tragic 5.8% |
| Immigrants from Poland | 3.8 /100 | #240 | Tragic 5.8% |
| Mongolians | 3.7 /100 | #241 | Tragic 5.8% |
| Immigrants from Middle Africa | 3.4 /100 | #242 | Tragic 5.8% |
| Immigrants from Czechoslovakia | 3.2 /100 | #243 | Tragic 5.8% |
| Ethiopians | 3.2 /100 | #244 | Tragic 5.8% |
Turkish 4 or more Vehicles in Household Correlation Summary
| Measurement | Turkish Data | 4 or more Vehicles in Household Data |
| Minimum | 0.061% | 1.1% |
| Maximum | 29.4% | 30.2% |
| Range | 29.4% | 29.1% |
| Mean | 4.6% | 9.1% |
| Median | 3.3% | 7.0% |
| Interquartile 25% (IQ1) | 1.7% | 5.6% |
| Interquartile 75% (IQ3) | 5.5% | 10.5% |
| Interquartile Range (IQR) | 3.9% | 4.9% |
| Standard Deviation (Sample) | 4.9% | 6.0% |
| Standard Deviation (Population) | 4.8% | 5.9% |
Correlation Details
| Turkish Percentile | Sample Size | 4 or more Vehicles in Household |
[ 0.0% - 0.5% ] 0.061% | 188,810,327 | 6.3% |
[ 0.0% - 0.5% ] 0.20% | 48,981,404 | 4.8% |
[ 0.0% - 0.5% ] 0.36% | 14,581,873 | 5.6% |
[ 0.5% - 1.0% ] 0.51% | 6,999,556 | 5.5% |
[ 0.5% - 1.0% ] 0.65% | 3,883,219 | 5.8% |
[ 0.5% - 1.0% ] 0.80% | 2,229,151 | 6.5% |
[ 0.5% - 1.0% ] 0.95% | 1,452,023 | 5.6% |
[ 1.0% - 1.5% ] 1.11% | 745,105 | 7.6% |
[ 1.0% - 1.5% ] 1.25% | 612,680 | 6.9% |
[ 1.0% - 1.5% ] 1.40% | 448,857 | 6.7% |
[ 1.5% - 2.0% ] 1.54% | 492,735 | 4.7% |
[ 1.5% - 2.0% ] 1.66% | 260,880 | 8.7% |
[ 1.5% - 2.0% ] 1.83% | 294,135 | 6.7% |
[ 1.5% - 2.0% ] 1.98% | 136,742 | 6.2% |
[ 2.0% - 2.5% ] 2.16% | 96,873 | 7.5% |
[ 2.0% - 2.5% ] 2.31% | 67,365 | 9.2% |
[ 2.0% - 2.5% ] 2.39% | 58,665 | 6.3% |
[ 2.5% - 3.0% ] 2.56% | 48,168 | 8.8% |
[ 2.5% - 3.0% ] 2.77% | 29,265 | 11.7% |
[ 2.5% - 3.0% ] 2.88% | 54,287 | 6.2% |
[ 3.0% - 3.5% ] 3.01% | 52,223 | 6.6% |
[ 3.0% - 3.5% ] 3.16% | 3,611 | 17.5% |
[ 3.0% - 3.5% ] 3.25% | 17,340 | 6.0% |
[ 3.0% - 3.5% ] 3.42% | 1,314 | 15.5% |
[ 3.5% - 4.0% ] 3.62% | 33,609 | 3.7% |
[ 3.5% - 4.0% ] 3.73% | 29,775 | 1.1% |
[ 3.5% - 4.0% ] 3.90% | 13,394 | 7.6% |
[ 4.0% - 4.5% ] 4.10% | 11,623 | 8.1% |
[ 4.0% - 4.5% ] 4.18% | 26,829 | 7.6% |
[ 4.0% - 4.5% ] 4.29% | 19,287 | 4.4% |
[ 4.0% - 4.5% ] 4.47% | 10,897 | 5.1% |
[ 5.0% - 5.5% ] 5.08% | 59 | 18.2% |
[ 5.0% - 5.5% ] 5.19% | 1,463 | 3.0% |
[ 5.0% - 5.5% ] 5.30% | 434 | 12.2% |
[ 5.5% - 6.0% ] 5.51% | 381 | 12.1% |
[ 6.0% - 6.5% ] 6.13% | 1,616 | 8.3% |
[ 6.0% - 6.5% ] 6.44% | 21,950 | 7.2% |
[ 6.5% - 7.0% ] 6.90% | 29 | 25.0% |
[ 7.5% - 8.0% ] 7.66% | 4,150 | 2.2% |
[ 8.0% - 8.5% ] 8.36% | 11,458 | 8.6% |
[ 9.0% - 9.5% ] 9.17% | 1,669 | 20.0% |
[ 10.0% - 10.5% ] 10.10% | 5,476 | 4.0% |
[ 11.0% - 11.5% ] 11.04% | 1,857 | 10.5% |
[ 12.0% - 12.5% ] 12.16% | 148 | 30.2% |
[ 12.0% - 12.5% ] 12.27% | 375 | 13.3% |
[ 29.0% - 29.5% ] 29.41% | 34 | 21.4% |