Croatian 4 or more Vehicles in Household
COMPARE
Croatian
Select to Compare
4 or more Vehicles in Household
Croatian 4 or more Vehicles in Household
6.5%
4+ VEHICLES AVAILABLE
77.8/ 100
METRIC RATING
145th/ 347
METRIC RANK
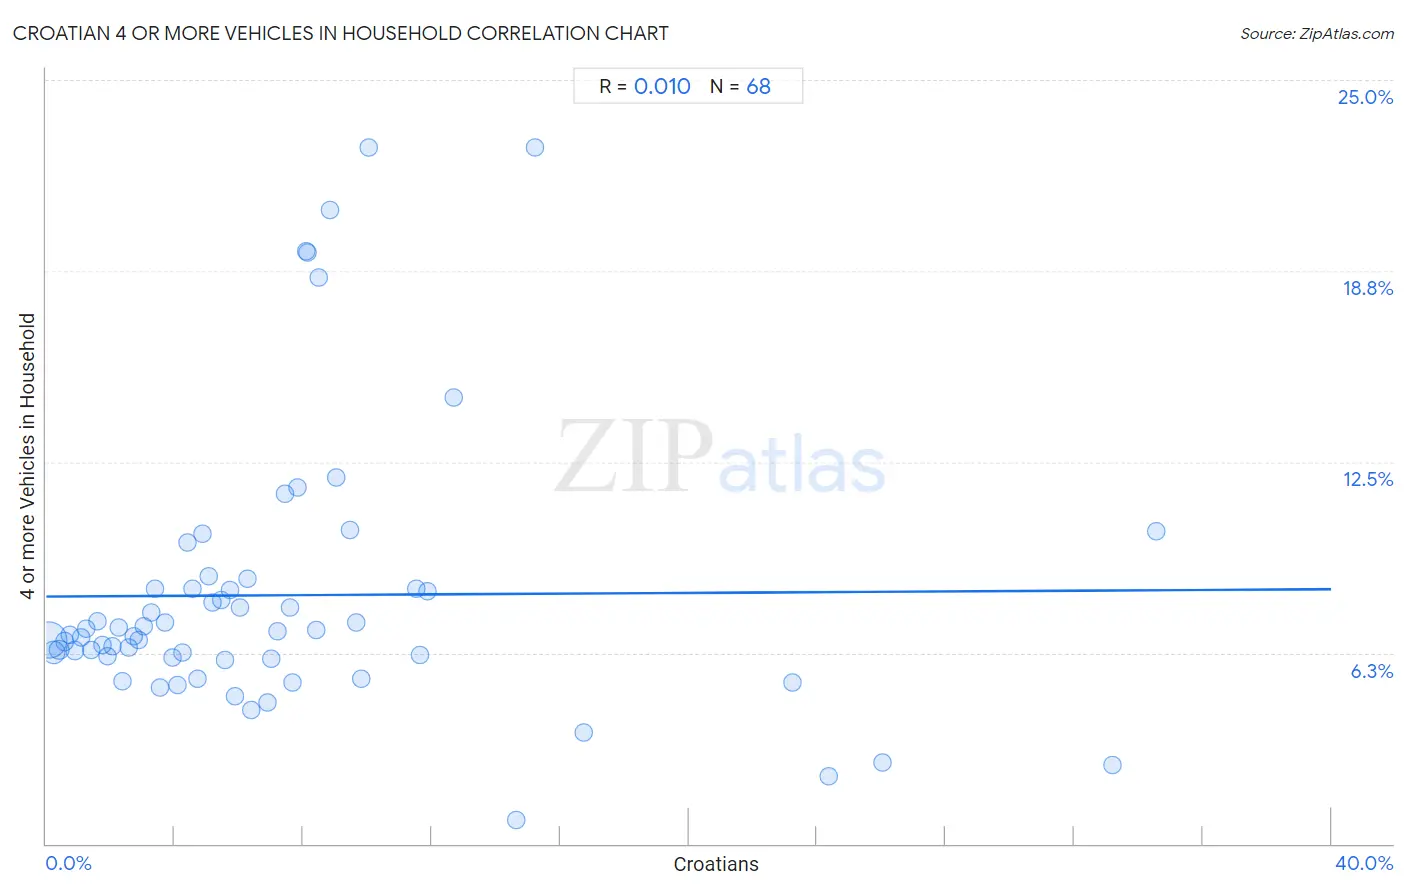
Croatian 4 or more Vehicles in Household Correlation Chart
The statistical analysis conducted on geographies consisting of 374,283,631 people shows no correlation between the proportion of Croatians and percentage of households with 4 or more vehicles available in the United States with a correlation coefficient (R) of 0.010 and weighted average of 6.5%. On average, for every 1% (one percent) increase in Croatians within a typical geography, there is an increase of 0.0061% in percentage of households with 4 or more vehicles available.
It is essential to understand that the correlation between the percentage of Croatians and percentage of households with 4 or more vehicles available does not imply a direct cause-and-effect relationship. It remains uncertain whether the presence of Croatians influences an upward or downward trend in the level of percentage of households with 4 or more vehicles available within an area, or if Croatians simply ended up residing in those areas with higher or lower levels of percentage of households with 4 or more vehicles available due to other factors.
Demographics Similar to Croatians by 4 or more Vehicles in Household
In terms of 4 or more vehicles in household, the demographic groups most similar to Croatians are Immigrants from North America (6.5%, a difference of 0.10%), Immigrants from Canada (6.5%, a difference of 0.11%), Immigrants from Iraq (6.5%, a difference of 0.25%), Australian (6.6%, a difference of 0.45%), and Immigrants from Costa Rica (6.5%, a difference of 0.46%).
| Demographics | Rating | Rank | 4 or more Vehicles in Household |
| Italians | 84.5 /100 | #138 | Excellent 6.6% |
| Jordanians | 82.1 /100 | #139 | Excellent 6.6% |
| Slavs | 81.6 /100 | #140 | Excellent 6.6% |
| Australians | 80.8 /100 | #141 | Excellent 6.6% |
| Immigrants from Iraq | 79.4 /100 | #142 | Good 6.5% |
| Immigrants from Canada | 78.6 /100 | #143 | Good 6.5% |
| Immigrants from North America | 78.5 /100 | #144 | Good 6.5% |
| Croatians | 77.8 /100 | #145 | Good 6.5% |
| Immigrants from Costa Rica | 74.4 /100 | #146 | Good 6.5% |
| Immigrants from Iran | 73.9 /100 | #147 | Good 6.5% |
| Immigrants from Jordan | 73.7 /100 | #148 | Good 6.5% |
| Greeks | 73.6 /100 | #149 | Good 6.5% |
| New Zealanders | 73.3 /100 | #150 | Good 6.5% |
| Immigrants from Hong Kong | 72.2 /100 | #151 | Good 6.5% |
| Yuman | 72.1 /100 | #152 | Good 6.5% |
Croatian 4 or more Vehicles in Household Correlation Summary
| Measurement | Croatian Data | 4 or more Vehicles in Household Data |
| Minimum | 0.073% | 0.78% |
| Maximum | 34.6% | 22.8% |
| Range | 34.5% | 22.0% |
| Mean | 7.4% | 8.1% |
| Median | 5.7% | 6.9% |
| Interquartile 25% (IQ1) | 2.8% | 6.1% |
| Interquartile 75% (IQ3) | 8.9% | 8.3% |
| Interquartile Range (IQR) | 6.1% | 2.3% |
| Standard Deviation (Sample) | 7.1% | 4.5% |
| Standard Deviation (Population) | 7.1% | 4.5% |
Correlation Details
| Croatian Percentile | Sample Size | 4 or more Vehicles in Household |
[ 0.0% - 0.5% ] 0.073% | 255,396,137 | 6.7% |
[ 0.0% - 0.5% ] 0.23% | 69,973,895 | 6.3% |
[ 0.0% - 0.5% ] 0.40% | 22,843,533 | 6.4% |
[ 0.5% - 1.0% ] 0.57% | 9,746,822 | 6.6% |
[ 0.5% - 1.0% ] 0.74% | 5,801,140 | 6.8% |
[ 0.5% - 1.0% ] 0.91% | 3,173,362 | 6.3% |
[ 1.0% - 1.5% ] 1.08% | 1,817,456 | 6.7% |
[ 1.0% - 1.5% ] 1.24% | 1,028,450 | 7.0% |
[ 1.0% - 1.5% ] 1.40% | 650,226 | 6.3% |
[ 1.5% - 2.0% ] 1.58% | 536,410 | 7.3% |
[ 1.5% - 2.0% ] 1.75% | 636,492 | 6.5% |
[ 1.5% - 2.0% ] 1.91% | 514,902 | 6.2% |
[ 2.0% - 2.5% ] 2.07% | 345,913 | 6.5% |
[ 2.0% - 2.5% ] 2.24% | 371,566 | 7.1% |
[ 2.0% - 2.5% ] 2.39% | 329,526 | 5.3% |
[ 2.5% - 3.0% ] 2.58% | 167,346 | 6.4% |
[ 2.5% - 3.0% ] 2.71% | 113,474 | 6.8% |
[ 2.5% - 3.0% ] 2.89% | 167,570 | 6.7% |
[ 3.0% - 3.5% ] 3.03% | 127,494 | 7.1% |
[ 3.0% - 3.5% ] 3.26% | 31,512 | 7.6% |
[ 3.0% - 3.5% ] 3.39% | 65,332 | 8.4% |
[ 3.5% - 4.0% ] 3.56% | 41,701 | 5.1% |
[ 3.5% - 4.0% ] 3.71% | 83,505 | 7.3% |
[ 3.5% - 4.0% ] 3.92% | 20,962 | 6.1% |
[ 4.0% - 4.5% ] 4.08% | 31,818 | 5.2% |
[ 4.0% - 4.5% ] 4.23% | 113,867 | 6.3% |
[ 4.0% - 4.5% ] 4.40% | 8,882 | 9.9% |
[ 4.5% - 5.0% ] 4.53% | 14,691 | 8.3% |
[ 4.5% - 5.0% ] 4.70% | 9,862 | 5.4% |
[ 4.5% - 5.0% ] 4.88% | 8,704 | 10.2% |
[ 5.0% - 5.5% ] 5.07% | 4,797 | 8.8% |
[ 5.0% - 5.5% ] 5.19% | 12,687 | 7.9% |
[ 5.0% - 5.5% ] 5.44% | 2,722 | 8.0% |
[ 5.5% - 6.0% ] 5.58% | 29,415 | 6.0% |
[ 5.5% - 6.0% ] 5.73% | 7,699 | 8.3% |
[ 5.5% - 6.0% ] 5.86% | 10,293 | 4.8% |
[ 6.0% - 6.5% ] 6.04% | 5,533 | 7.7% |
[ 6.0% - 6.5% ] 6.26% | 3,307 | 8.7% |
[ 6.0% - 6.5% ] 6.39% | 2,521 | 4.4% |
[ 6.5% - 7.0% ] 6.89% | 5,038 | 4.6% |
[ 7.0% - 7.5% ] 7.00% | 9,094 | 6.1% |
[ 7.0% - 7.5% ] 7.20% | 542 | 6.9% |
[ 7.0% - 7.5% ] 7.42% | 917 | 11.4% |
[ 7.5% - 8.0% ] 7.57% | 1,823 | 7.7% |
[ 7.5% - 8.0% ] 7.68% | 612 | 5.3% |
[ 7.5% - 8.0% ] 7.83% | 1,251 | 11.7% |
[ 8.0% - 8.5% ] 8.09% | 1,285 | 19.4% |
[ 8.0% - 8.5% ] 8.15% | 270 | 19.3% |
[ 8.0% - 8.5% ] 8.41% | 904 | 7.0% |
[ 8.0% - 8.5% ] 8.47% | 59 | 18.5% |
[ 8.5% - 9.0% ] 8.82% | 204 | 20.7% |
[ 9.0% - 9.5% ] 9.04% | 365 | 12.0% |
[ 9.0% - 9.5% ] 9.47% | 665 | 10.3% |
[ 9.5% - 10.0% ] 9.64% | 394 | 7.3% |
[ 9.5% - 10.0% ] 9.82% | 1,181 | 5.4% |
[ 10.0% - 10.5% ] 10.02% | 409 | 22.8% |
[ 11.5% - 12.0% ] 11.50% | 339 | 8.3% |
[ 11.5% - 12.0% ] 11.62% | 912 | 6.2% |
[ 11.5% - 12.0% ] 11.87% | 396 | 8.3% |
[ 12.5% - 13.0% ] 12.68% | 891 | 14.6% |
[ 14.5% - 15.0% ] 14.62% | 253 | 0.78% |
[ 15.0% - 15.5% ] 15.22% | 427 | 22.8% |
[ 16.5% - 17.0% ] 16.74% | 1,111 | 3.6% |
[ 23.0% - 23.5% ] 23.25% | 985 | 5.3% |
[ 24.0% - 24.5% ] 24.36% | 312 | 2.2% |
[ 26.0% - 26.5% ] 26.04% | 672 | 2.7% |
[ 33.0% - 33.5% ] 33.19% | 229 | 2.6% |
[ 34.5% - 35.0% ] 34.57% | 567 | 10.2% |