Immigrants from Scotland 4 or more Vehicles in Household
COMPARE
Immigrants from Scotland
Select to Compare
4 or more Vehicles in Household
Immigrants from Scotland 4 or more Vehicles in Household
6.7%
4+ VEHICLES AVAILABLE
89.0/ 100
METRIC RATING
130th/ 347
METRIC RANK
Immigrants from Scotland 4 or more Vehicles in Household Correlation Chart
The statistical analysis conducted on geographies consisting of 195,944,485 people shows a mild positive correlation between the proportion of Immigrants from Scotland and percentage of households with 4 or more vehicles available in the United States with a correlation coefficient (R) of 0.314 and weighted average of 6.7%. On average, for every 1% (one percent) increase in Immigrants from Scotland within a typical geography, there is an increase of 0.96% in percentage of households with 4 or more vehicles available.
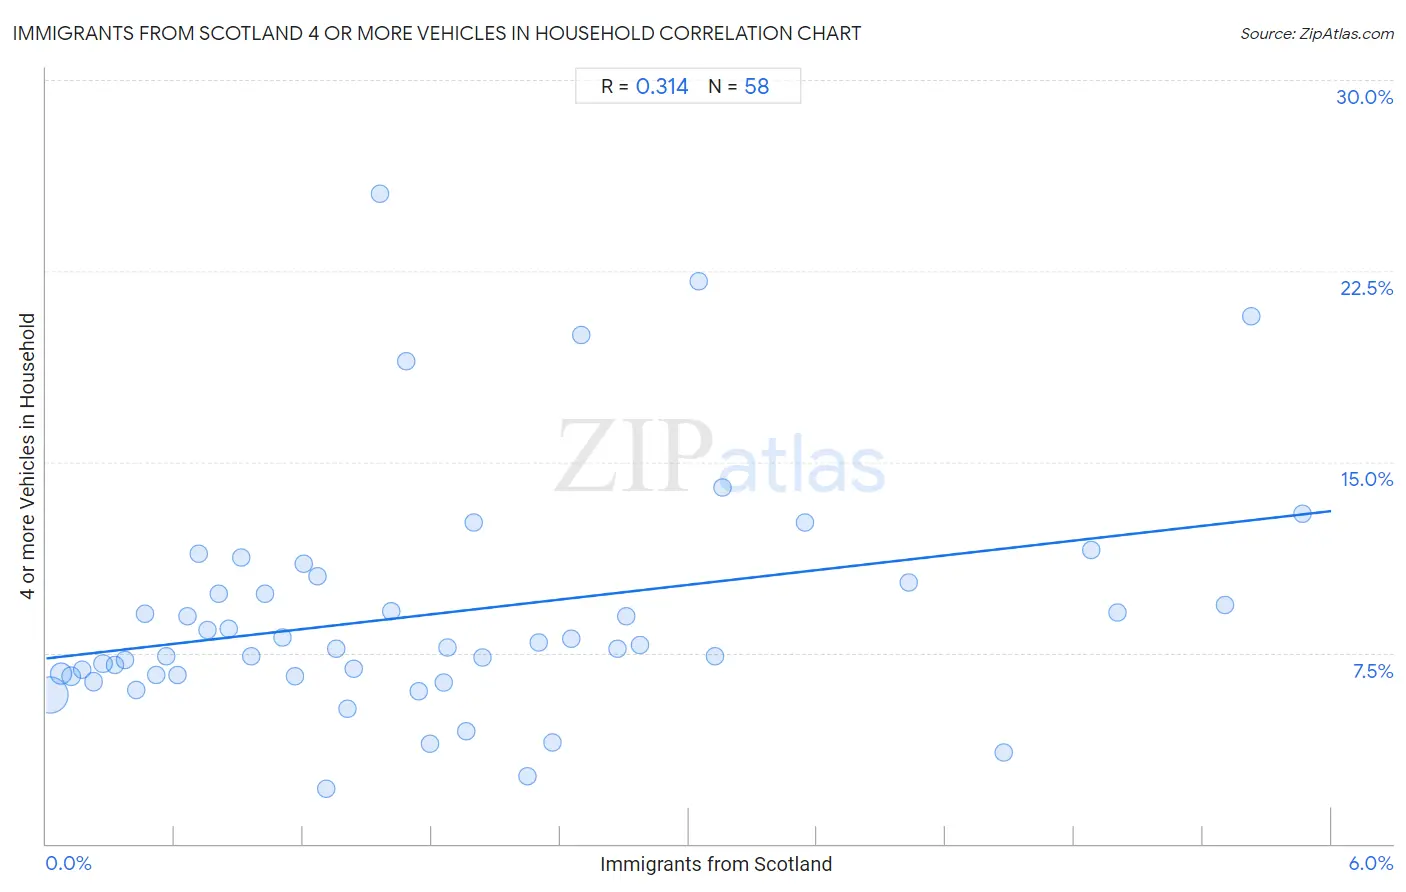
It is essential to understand that the correlation between the percentage of Immigrants from Scotland and percentage of households with 4 or more vehicles available does not imply a direct cause-and-effect relationship. It remains uncertain whether the presence of Immigrants from Scotland influences an upward or downward trend in the level of percentage of households with 4 or more vehicles available within an area, or if Immigrants from Scotland simply ended up residing in those areas with higher or lower levels of percentage of households with 4 or more vehicles available due to other factors.
Demographics Similar to Immigrants from Scotland by 4 or more Vehicles in Household
In terms of 4 or more vehicles in household, the demographic groups most similar to Immigrants from Scotland are Maltese (6.7%, a difference of 0.15%), Immigrants from Netherlands (6.6%, a difference of 0.29%), Armenian (6.6%, a difference of 0.48%), Ottawa (6.6%, a difference of 0.50%), and Tohono O'odham (6.6%, a difference of 0.53%).
| Demographics | Rating | Rank | 4 or more Vehicles in Household |
| Immigrants | 94.6 /100 | #123 | Exceptional 6.8% |
| Immigrants from Asia | 94.4 /100 | #124 | Exceptional 6.8% |
| Austrians | 94.1 /100 | #125 | Exceptional 6.8% |
| Belgians | 94.1 /100 | #126 | Exceptional 6.8% |
| Immigrants from Korea | 93.8 /100 | #127 | Exceptional 6.8% |
| Immigrants from Bolivia | 92.5 /100 | #128 | Exceptional 6.7% |
| Immigrants from England | 92.0 /100 | #129 | Exceptional 6.7% |
| Immigrants from Scotland | 89.0 /100 | #130 | Excellent 6.7% |
| Maltese | 88.4 /100 | #131 | Excellent 6.7% |
| Immigrants from Netherlands | 87.8 /100 | #132 | Excellent 6.6% |
| Armenians | 86.9 /100 | #133 | Excellent 6.6% |
| Ottawa | 86.9 /100 | #134 | Excellent 6.6% |
| Tohono O'odham | 86.7 /100 | #135 | Excellent 6.6% |
| Luxembourgers | 86.4 /100 | #136 | Excellent 6.6% |
| French Canadians | 85.4 /100 | #137 | Excellent 6.6% |
Immigrants from Scotland 4 or more Vehicles in Household Correlation Summary
| Measurement | Immigrants from Scotland Data | 4 or more Vehicles in Household Data |
| Minimum | 0.020% | 2.2% |
| Maximum | 5.9% | 25.6% |
| Range | 5.8% | 23.4% |
| Mean | 1.9% | 9.1% |
| Median | 1.5% | 7.7% |
| Interquartile 25% (IQ1) | 0.71% | 6.6% |
| Interquartile 75% (IQ3) | 2.5% | 10.3% |
| Interquartile Range (IQR) | 1.8% | 3.6% |
| Standard Deviation (Sample) | 1.5% | 4.6% |
| Standard Deviation (Population) | 1.5% | 4.6% |
Correlation Details
| Immigrants from Scotland Percentile | Sample Size | 4 or more Vehicles in Household |
[ 0.0% - 0.5% ] 0.020% | 142,007,669 | 5.8% |
[ 0.0% - 0.5% ] 0.069% | 31,095,419 | 6.7% |
[ 0.0% - 0.5% ] 0.12% | 10,187,708 | 6.6% |
[ 0.0% - 0.5% ] 0.17% | 4,800,147 | 6.8% |
[ 0.0% - 0.5% ] 0.22% | 2,904,124 | 6.4% |
[ 0.0% - 0.5% ] 0.27% | 1,421,124 | 7.1% |
[ 0.0% - 0.5% ] 0.32% | 997,831 | 7.0% |
[ 0.0% - 0.5% ] 0.37% | 582,679 | 7.2% |
[ 0.0% - 0.5% ] 0.42% | 400,331 | 6.0% |
[ 0.0% - 0.5% ] 0.46% | 381,946 | 9.0% |
[ 0.5% - 1.0% ] 0.51% | 303,696 | 6.7% |
[ 0.5% - 1.0% ] 0.56% | 110,700 | 7.4% |
[ 0.5% - 1.0% ] 0.61% | 134,952 | 6.6% |
[ 0.5% - 1.0% ] 0.66% | 108,196 | 8.9% |
[ 0.5% - 1.0% ] 0.71% | 113,635 | 11.4% |
[ 0.5% - 1.0% ] 0.75% | 32,359 | 8.4% |
[ 0.5% - 1.0% ] 0.81% | 21,854 | 9.8% |
[ 0.5% - 1.0% ] 0.85% | 60,654 | 8.4% |
[ 0.5% - 1.0% ] 0.91% | 26,100 | 11.3% |
[ 0.5% - 1.0% ] 0.96% | 33,684 | 7.4% |
[ 1.0% - 1.5% ] 1.02% | 20,482 | 9.8% |
[ 1.0% - 1.5% ] 1.10% | 5,265 | 8.1% |
[ 1.0% - 1.5% ] 1.16% | 22,289 | 6.6% |
[ 1.0% - 1.5% ] 1.20% | 6,412 | 11.0% |
[ 1.0% - 1.5% ] 1.26% | 21,979 | 10.5% |
[ 1.0% - 1.5% ] 1.31% | 1,528 | 2.2% |
[ 1.0% - 1.5% ] 1.35% | 34,211 | 7.7% |
[ 1.0% - 1.5% ] 1.40% | 19,360 | 5.3% |
[ 1.0% - 1.5% ] 1.43% | 8,022 | 6.9% |
[ 1.5% - 2.0% ] 1.56% | 2,435 | 25.6% |
[ 1.5% - 2.0% ] 1.61% | 12,678 | 9.2% |
[ 1.5% - 2.0% ] 1.68% | 3,329 | 18.9% |
[ 1.5% - 2.0% ] 1.74% | 5,570 | 6.0% |
[ 1.5% - 2.0% ] 1.79% | 279 | 3.9% |
[ 1.5% - 2.0% ] 1.86% | 9,695 | 6.4% |
[ 1.5% - 2.0% ] 1.88% | 5,010 | 7.7% |
[ 1.5% - 2.0% ] 1.96% | 1,172 | 4.4% |
[ 1.5% - 2.0% ] 2.00% | 9,513 | 12.6% |
[ 2.0% - 2.5% ] 2.03% | 2,900 | 7.3% |
[ 2.0% - 2.5% ] 2.24% | 3,920 | 2.7% |
[ 2.0% - 2.5% ] 2.30% | 1,260 | 7.9% |
[ 2.0% - 2.5% ] 2.36% | 254 | 4.0% |
[ 2.0% - 2.5% ] 2.45% | 163 | 8.1% |
[ 2.0% - 2.5% ] 2.50% | 240 | 20.0% |
[ 2.5% - 3.0% ] 2.67% | 1,462 | 7.7% |
[ 2.5% - 3.0% ] 2.71% | 6,051 | 8.9% |
[ 2.5% - 3.0% ] 2.77% | 2,811 | 7.8% |
[ 3.0% - 3.5% ] 3.04% | 3,120 | 22.1% |
[ 3.0% - 3.5% ] 3.12% | 1,824 | 7.4% |
[ 3.0% - 3.5% ] 3.16% | 887 | 14.0% |
[ 3.5% - 4.0% ] 3.54% | 1,101 | 12.6% |
[ 4.0% - 4.5% ] 4.03% | 298 | 10.3% |
[ 4.0% - 4.5% ] 4.47% | 470 | 3.6% |
[ 4.5% - 5.0% ] 4.88% | 1,824 | 11.5% |
[ 5.0% - 5.5% ] 5.00% | 20 | 9.1% |
[ 5.5% - 6.0% ] 5.50% | 981 | 9.4% |
[ 5.5% - 6.0% ] 5.63% | 231 | 20.7% |
[ 5.5% - 6.0% ] 5.86% | 631 | 13.0% |