Immigrants from Iraq 4 or more Vehicles in Household
COMPARE
Immigrants from Iraq
Select to Compare
4 or more Vehicles in Household
Immigrants from Iraq 4 or more Vehicles in Household
6.5%
4+ VEHICLES AVAILABLE
79.4/ 100
METRIC RATING
142nd/ 347
METRIC RANK
Immigrants from Iraq 4 or more Vehicles in Household Correlation Chart
The statistical analysis conducted on geographies consisting of 194,531,934 people shows a poor positive correlation between the proportion of Immigrants from Iraq and percentage of households with 4 or more vehicles available in the United States with a correlation coefficient (R) of 0.135 and weighted average of 6.5%. On average, for every 1% (one percent) increase in Immigrants from Iraq within a typical geography, there is an increase of 0.11% in percentage of households with 4 or more vehicles available.
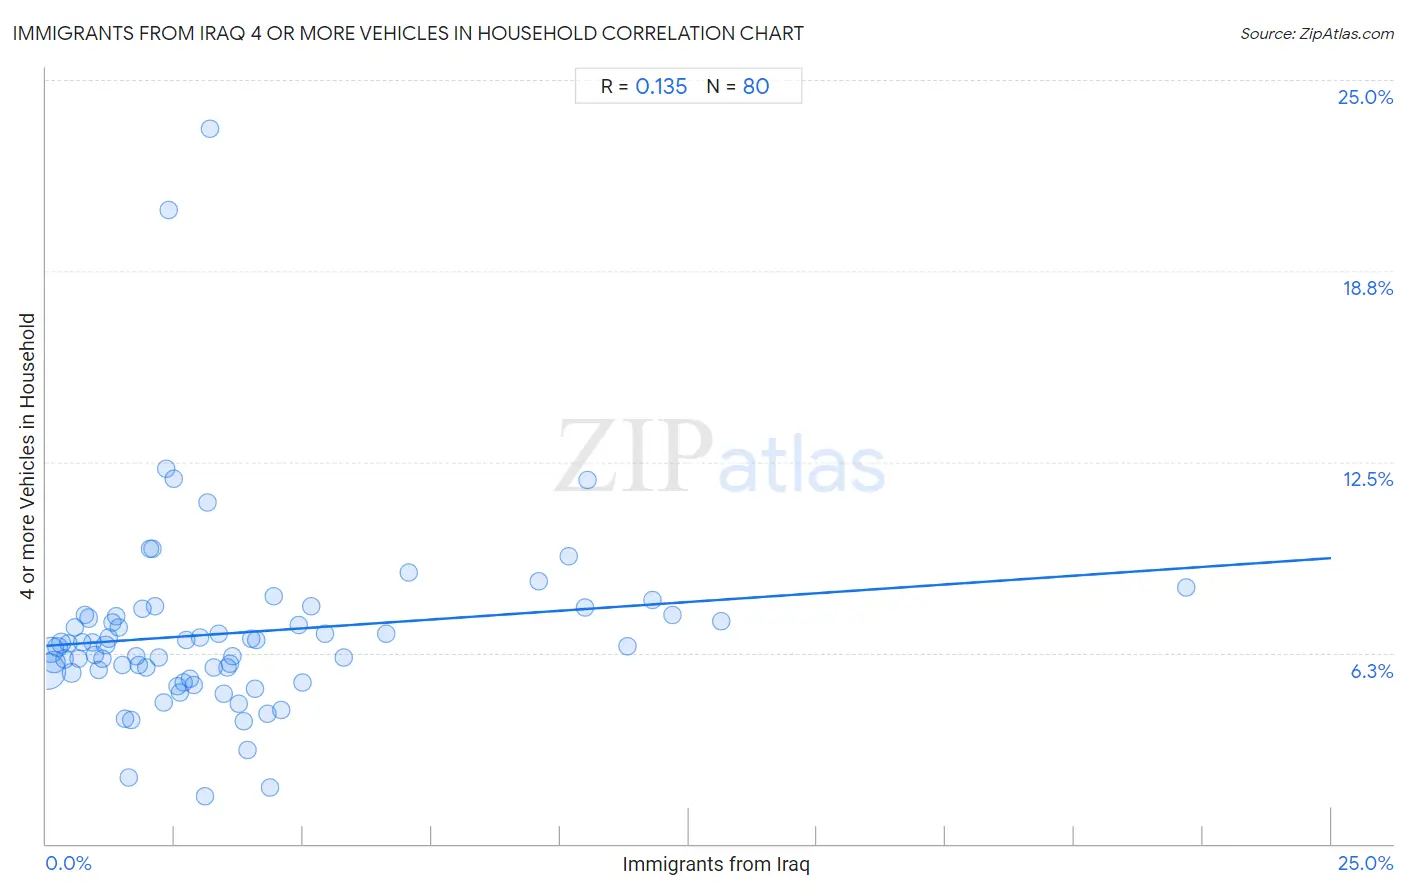
It is essential to understand that the correlation between the percentage of Immigrants from Iraq and percentage of households with 4 or more vehicles available does not imply a direct cause-and-effect relationship. It remains uncertain whether the presence of Immigrants from Iraq influences an upward or downward trend in the level of percentage of households with 4 or more vehicles available within an area, or if Immigrants from Iraq simply ended up residing in those areas with higher or lower levels of percentage of households with 4 or more vehicles available due to other factors.
Demographics Similar to Immigrants from Iraq by 4 or more Vehicles in Household
In terms of 4 or more vehicles in household, the demographic groups most similar to Immigrants from Iraq are Immigrants from Canada (6.5%, a difference of 0.13%), Immigrants from North America (6.5%, a difference of 0.15%), Australian (6.6%, a difference of 0.20%), Croatian (6.5%, a difference of 0.25%), and Slavic (6.6%, a difference of 0.33%).
| Demographics | Rating | Rank | 4 or more Vehicles in Household |
| Tohono O'odham | 86.7 /100 | #135 | Excellent 6.6% |
| Luxembourgers | 86.4 /100 | #136 | Excellent 6.6% |
| French Canadians | 85.4 /100 | #137 | Excellent 6.6% |
| Italians | 84.5 /100 | #138 | Excellent 6.6% |
| Jordanians | 82.1 /100 | #139 | Excellent 6.6% |
| Slavs | 81.6 /100 | #140 | Excellent 6.6% |
| Australians | 80.8 /100 | #141 | Excellent 6.6% |
| Immigrants from Iraq | 79.4 /100 | #142 | Good 6.5% |
| Immigrants from Canada | 78.6 /100 | #143 | Good 6.5% |
| Immigrants from North America | 78.5 /100 | #144 | Good 6.5% |
| Croatians | 77.8 /100 | #145 | Good 6.5% |
| Immigrants from Costa Rica | 74.4 /100 | #146 | Good 6.5% |
| Immigrants from Iran | 73.9 /100 | #147 | Good 6.5% |
| Immigrants from Jordan | 73.7 /100 | #148 | Good 6.5% |
| Greeks | 73.6 /100 | #149 | Good 6.5% |
Immigrants from Iraq 4 or more Vehicles in Household Correlation Summary
| Measurement | Immigrants from Iraq Data | 4 or more Vehicles in Household Data |
| Minimum | 0.030% | 1.6% |
| Maximum | 22.2% | 23.4% |
| Range | 22.1% | 21.8% |
| Mean | 3.6% | 6.9% |
| Median | 2.6% | 6.5% |
| Interquartile 25% (IQ1) | 1.3% | 5.6% |
| Interquartile 75% (IQ3) | 4.2% | 7.5% |
| Interquartile Range (IQR) | 2.9% | 1.9% |
| Standard Deviation (Sample) | 3.7% | 3.1% |
| Standard Deviation (Population) | 3.7% | 3.1% |
Correlation Details
| Immigrants from Iraq Percentile | Sample Size | 4 or more Vehicles in Household |
[ 0.0% - 0.5% ] 0.030% | 91,494,617 | 5.6% |
[ 0.0% - 0.5% ] 0.097% | 38,046,717 | 6.3% |
[ 0.0% - 0.5% ] 0.16% | 22,578,590 | 5.9% |
[ 0.0% - 0.5% ] 0.23% | 11,061,078 | 6.4% |
[ 0.0% - 0.5% ] 0.29% | 6,986,968 | 6.6% |
[ 0.0% - 0.5% ] 0.36% | 3,910,067 | 6.0% |
[ 0.0% - 0.5% ] 0.43% | 3,407,810 | 6.6% |
[ 0.0% - 0.5% ] 0.49% | 2,234,615 | 5.6% |
[ 0.5% - 1.0% ] 0.56% | 1,331,247 | 7.1% |
[ 0.5% - 1.0% ] 0.63% | 1,564,445 | 6.1% |
[ 0.5% - 1.0% ] 0.69% | 2,248,752 | 6.6% |
[ 0.5% - 1.0% ] 0.75% | 825,995 | 7.5% |
[ 0.5% - 1.0% ] 0.82% | 845,468 | 7.4% |
[ 0.5% - 1.0% ] 0.89% | 705,106 | 6.6% |
[ 0.5% - 1.0% ] 0.96% | 926,200 | 6.2% |
[ 1.0% - 1.5% ] 1.01% | 526,038 | 5.7% |
[ 1.0% - 1.5% ] 1.09% | 434,001 | 6.1% |
[ 1.0% - 1.5% ] 1.15% | 658,973 | 6.5% |
[ 1.0% - 1.5% ] 1.21% | 306,915 | 6.7% |
[ 1.0% - 1.5% ] 1.28% | 328,050 | 7.3% |
[ 1.0% - 1.5% ] 1.36% | 172,086 | 7.5% |
[ 1.0% - 1.5% ] 1.41% | 183,610 | 7.1% |
[ 1.0% - 1.5% ] 1.49% | 253,196 | 5.9% |
[ 1.5% - 2.0% ] 1.53% | 94,650 | 4.1% |
[ 1.5% - 2.0% ] 1.60% | 38,227 | 2.2% |
[ 1.5% - 2.0% ] 1.66% | 106,999 | 4.0% |
[ 1.5% - 2.0% ] 1.75% | 58,414 | 6.1% |
[ 1.5% - 2.0% ] 1.81% | 123,641 | 5.9% |
[ 1.5% - 2.0% ] 1.88% | 71,744 | 7.7% |
[ 1.5% - 2.0% ] 1.93% | 131,150 | 5.8% |
[ 2.0% - 2.5% ] 2.01% | 222,859 | 9.6% |
[ 2.0% - 2.5% ] 2.07% | 109,104 | 9.6% |
[ 2.0% - 2.5% ] 2.12% | 71,140 | 7.8% |
[ 2.0% - 2.5% ] 2.20% | 115,707 | 6.1% |
[ 2.0% - 2.5% ] 2.28% | 66,618 | 4.6% |
[ 2.0% - 2.5% ] 2.34% | 49,287 | 12.3% |
[ 2.0% - 2.5% ] 2.39% | 2,890 | 20.7% |
[ 2.0% - 2.5% ] 2.48% | 19,258 | 11.9% |
[ 2.5% - 3.0% ] 2.56% | 132,048 | 5.1% |
[ 2.5% - 3.0% ] 2.60% | 65,411 | 5.0% |
[ 2.5% - 3.0% ] 2.68% | 115,504 | 5.3% |
[ 2.5% - 3.0% ] 2.72% | 41,902 | 6.7% |
[ 2.5% - 3.0% ] 2.81% | 74,389 | 5.4% |
[ 2.5% - 3.0% ] 2.88% | 130,465 | 5.2% |
[ 2.5% - 3.0% ] 2.98% | 238,915 | 6.7% |
[ 3.0% - 3.5% ] 3.08% | 4,028 | 1.6% |
[ 3.0% - 3.5% ] 3.14% | 509 | 11.2% |
[ 3.0% - 3.5% ] 3.19% | 251 | 23.4% |
[ 3.0% - 3.5% ] 3.25% | 58,572 | 5.8% |
[ 3.0% - 3.5% ] 3.34% | 7,444 | 6.9% |
[ 3.0% - 3.5% ] 3.44% | 110,117 | 4.9% |
[ 3.5% - 4.0% ] 3.54% | 21,468 | 5.7% |
[ 3.5% - 4.0% ] 3.58% | 36,981 | 5.9% |
[ 3.5% - 4.0% ] 3.62% | 15,017 | 6.1% |
[ 3.5% - 4.0% ] 3.75% | 33,170 | 4.6% |
[ 3.5% - 4.0% ] 3.85% | 67,076 | 4.0% |
[ 3.5% - 4.0% ] 3.91% | 74,049 | 3.1% |
[ 3.5% - 4.0% ] 4.00% | 2,803 | 6.7% |
[ 4.0% - 4.5% ] 4.05% | 62,474 | 5.1% |
[ 4.0% - 4.5% ] 4.08% | 25,051 | 6.7% |
[ 4.0% - 4.5% ] 4.30% | 16,850 | 4.2% |
[ 4.0% - 4.5% ] 4.36% | 9,951 | 1.9% |
[ 4.0% - 4.5% ] 4.43% | 16,742 | 8.1% |
[ 4.5% - 5.0% ] 4.56% | 57,421 | 4.4% |
[ 4.5% - 5.0% ] 4.91% | 30,802 | 7.2% |
[ 4.5% - 5.0% ] 4.98% | 53,044 | 5.3% |
[ 5.0% - 5.5% ] 5.16% | 63,085 | 7.8% |
[ 5.0% - 5.5% ] 5.42% | 22,152 | 6.9% |
[ 5.5% - 6.0% ] 5.78% | 34,004 | 6.1% |
[ 6.5% - 7.0% ] 6.61% | 27,848 | 6.9% |
[ 7.0% - 7.5% ] 7.05% | 69,638 | 8.9% |
[ 9.5% - 10.0% ] 9.58% | 21,587 | 8.6% |
[ 10.0% - 10.5% ] 10.17% | 22,430 | 9.4% |
[ 10.0% - 10.5% ] 10.48% | 33,174 | 7.7% |
[ 10.5% - 11.0% ] 10.54% | 45,937 | 11.9% |
[ 11.0% - 11.5% ] 11.30% | 34,921 | 6.4% |
[ 11.5% - 12.0% ] 11.80% | 59,775 | 8.0% |
[ 12.0% - 12.5% ] 12.19% | 105,721 | 7.5% |
[ 13.0% - 13.5% ] 13.14% | 133,744 | 7.3% |
[ 22.0% - 22.5% ] 22.18% | 43,232 | 8.4% |