Pima 4 or more Vehicles in Household
COMPARE
Pima
Select to Compare
4 or more Vehicles in Household
Pima 4 or more Vehicles in Household
7.9%
4+ VEHICLES AVAILABLE
100.0/ 100
METRIC RATING
41st/ 347
METRIC RANK
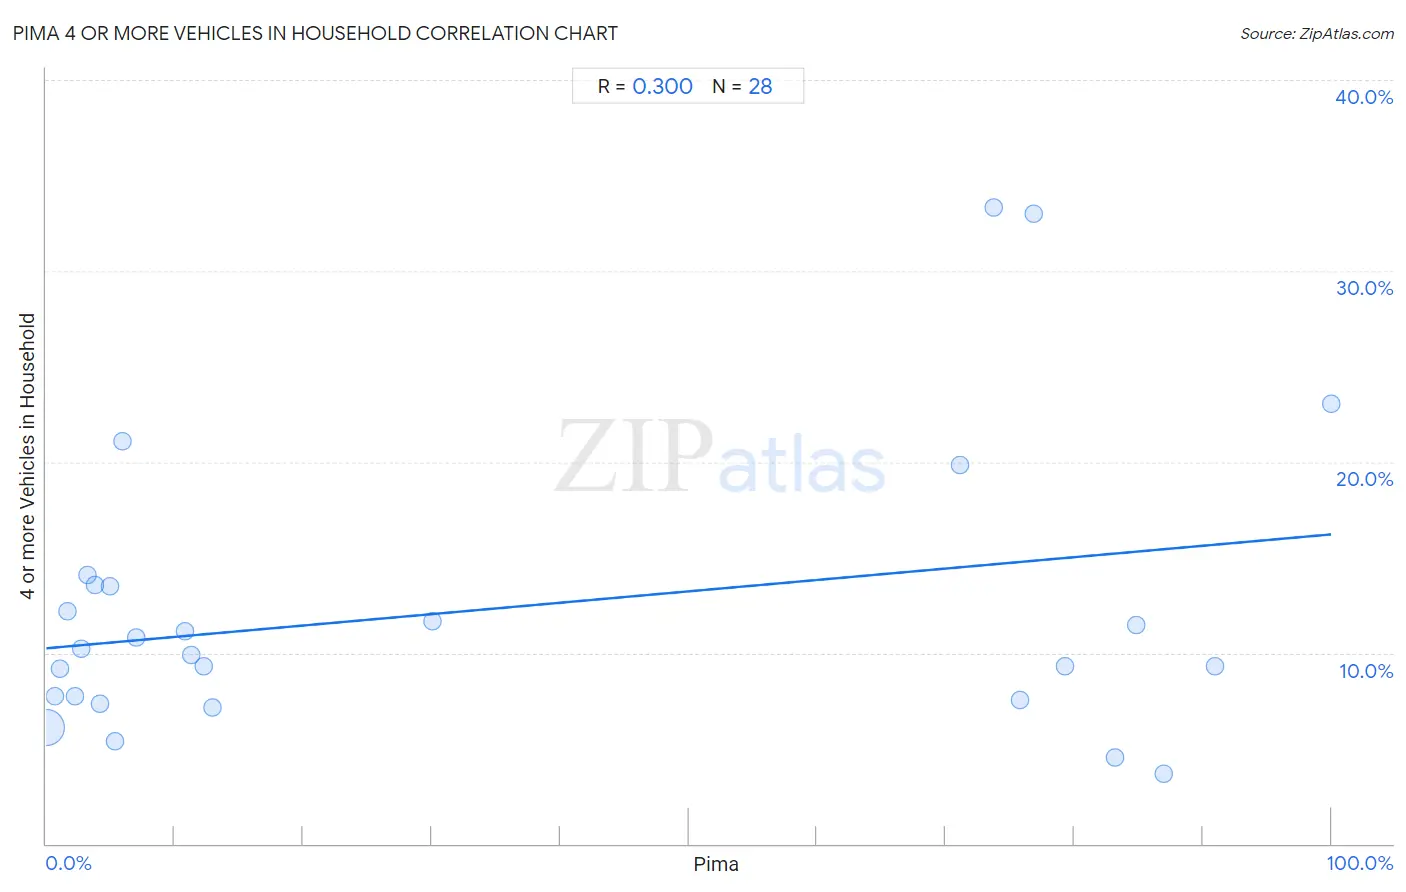
Pima 4 or more Vehicles in Household Correlation Chart
The statistical analysis conducted on geographies consisting of 61,524,905 people shows a weak positive correlation between the proportion of Pima and percentage of households with 4 or more vehicles available in the United States with a correlation coefficient (R) of 0.300 and weighted average of 7.9%. On average, for every 1% (one percent) increase in Pima within a typical geography, there is an increase of 0.060% in percentage of households with 4 or more vehicles available.
It is essential to understand that the correlation between the percentage of Pima and percentage of households with 4 or more vehicles available does not imply a direct cause-and-effect relationship. It remains uncertain whether the presence of Pima influences an upward or downward trend in the level of percentage of households with 4 or more vehicles available within an area, or if Pima simply ended up residing in those areas with higher or lower levels of percentage of households with 4 or more vehicles available due to other factors.
Demographics Similar to Pima by 4 or more Vehicles in Household
In terms of 4 or more vehicles in household, the demographic groups most similar to Pima are Salvadoran (7.8%, a difference of 0.49%), Spanish (7.9%, a difference of 0.57%), Fijian (7.8%, a difference of 0.60%), Bhutanese (7.8%, a difference of 0.86%), and Choctaw (7.8%, a difference of 0.92%).
| Demographics | Rating | Rank | 4 or more Vehicles in Household |
| Alaskan Athabascans | 100.0 /100 | #34 | Exceptional 8.1% |
| Guamanians/Chamorros | 100.0 /100 | #35 | Exceptional 8.1% |
| Norwegians | 100.0 /100 | #36 | Exceptional 8.0% |
| Scandinavians | 100.0 /100 | #37 | Exceptional 8.0% |
| Sioux | 100.0 /100 | #38 | Exceptional 8.0% |
| Spanish Americans | 100.0 /100 | #39 | Exceptional 8.0% |
| Spanish | 100.0 /100 | #40 | Exceptional 7.9% |
| Pima | 100.0 /100 | #41 | Exceptional 7.9% |
| Salvadorans | 100.0 /100 | #42 | Exceptional 7.8% |
| Fijians | 100.0 /100 | #43 | Exceptional 7.8% |
| Bhutanese | 100.0 /100 | #44 | Exceptional 7.8% |
| Choctaw | 100.0 /100 | #45 | Exceptional 7.8% |
| Crow | 100.0 /100 | #46 | Exceptional 7.8% |
| Osage | 100.0 /100 | #47 | Exceptional 7.8% |
| Swiss | 100.0 /100 | #48 | Exceptional 7.8% |
Pima 4 or more Vehicles in Household Correlation Summary
| Measurement | Pima Data | 4 or more Vehicles in Household Data |
| Minimum | 0.038% | 3.7% |
| Maximum | 100.0% | 33.3% |
| Range | 100.0% | 29.7% |
| Mean | 33.7% | 12.2% |
| Median | 11.0% | 10.0% |
| Interquartile 25% (IQ1) | 3.5% | 7.6% |
| Interquartile 75% (IQ3) | 76.3% | 13.5% |
| Interquartile Range (IQR) | 72.8% | 5.9% |
| Standard Deviation (Sample) | 37.7% | 7.5% |
| Standard Deviation (Population) | 37.0% | 7.4% |
Correlation Details
| Pima Percentile | Sample Size | 4 or more Vehicles in Household |
[ 0.0% - 0.5% ] 0.038% | 60,538,176 | 6.1% |
[ 0.5% - 1.0% ] 0.71% | 536,608 | 7.7% |
[ 1.0% - 1.5% ] 1.10% | 223,485 | 9.2% |
[ 1.5% - 2.0% ] 1.66% | 64,280 | 12.2% |
[ 2.0% - 2.5% ] 2.23% | 50,531 | 7.8% |
[ 2.5% - 3.0% ] 2.76% | 5,078 | 10.2% |
[ 3.0% - 3.5% ] 3.20% | 5,906 | 14.1% |
[ 3.5% - 4.0% ] 3.77% | 3,426 | 13.6% |
[ 4.0% - 4.5% ] 4.15% | 5,836 | 7.3% |
[ 4.5% - 5.0% ] 4.99% | 51,156 | 13.5% |
[ 5.0% - 5.5% ] 5.32% | 1,371 | 5.4% |
[ 5.5% - 6.0% ] 5.92% | 2,027 | 21.1% |
[ 7.0% - 7.5% ] 7.01% | 1,370 | 10.8% |
[ 10.5% - 11.0% ] 10.78% | 102 | 11.1% |
[ 11.0% - 11.5% ] 11.29% | 17,830 | 9.9% |
[ 12.0% - 12.5% ] 12.28% | 1,270 | 9.3% |
[ 12.5% - 13.0% ] 12.92% | 387 | 7.1% |
[ 30.0% - 30.5% ] 30.03% | 383 | 11.6% |
[ 71.0% - 71.5% ] 71.13% | 478 | 19.8% |
[ 73.5% - 74.0% ] 73.77% | 385 | 33.3% |
[ 75.5% - 76.0% ] 75.80% | 1,835 | 7.5% |
[ 76.5% - 77.0% ] 76.81% | 470 | 33.0% |
[ 79.0% - 79.5% ] 79.26% | 4,538 | 9.3% |
[ 83.0% - 83.5% ] 83.14% | 4,139 | 4.5% |
[ 84.5% - 85.0% ] 84.86% | 733 | 11.5% |
[ 86.5% - 87.0% ] 86.98% | 2,128 | 3.7% |
[ 90.5% - 91.0% ] 90.94% | 806 | 9.3% |
[ 99.5% - 100.0% ] 100.00% | 171 | 23.1% |