Immigrants from Northern Africa 4 or more Vehicles in Household

COMPARE

Immigrants from Northern Africa
Race
Ancestry
AfghanAfricanAlaska NativeAlaskan AthabascanAlbanianAleutAlsatianAmericanApacheArabArapahoArgentineanArmenianAssyrian/Chaldean/SyriacAustralianAustrianBahamianBangladeshiBarbadianBasqueBelgianBelizeanBermudanBhutaneseBlackfeetBolivianBrazilianBritishBritish West IndianBulgarianBurmeseCajunCambodianCanadianCape VerdeanCarpatho RusynCelticCentral AmericanCentral American IndianCherokeeCheyenneChickasawChileanChineseChippewaChoctawColombianColvilleComancheCosta RicanCreeCreekCroatianCrowCubanCypriotCzechCzechoslovakianDanishDelawareDominicanDutchDutch West IndianEastern EuropeanEcuadorianEgyptianEnglishEstonianEthiopianEuropeanFijianFilipinoFinnishFrenchFrench American IndianFrench CanadianGermanGerman RussianGhanaianGreekGuamanian/ChamorroGuatemalanGuyaneseHaitianHmongHonduranHopiHoumaHungarianIcelanderIndian (Asian)IndonesianInupiatIranianIraqiIrishIroquoisIsraeliItalianJamaicanJapaneseJordanianKenyanKiowaKoreanLaotianLatvianLebaneseLiberianLithuanianLumbeeLuxembourgerMacedonianMalaysianMalteseMarshalleseMenomineeMexicanMexican American IndianMongolianMoroccanNative HawaiianNavajoNepaleseNew ZealanderNicaraguanNigerianNorthern EuropeanNorwegianOkinawanOsageOttawaPaiutePakistaniPalestinianPanamanianParaguayanPennsylvania GermanPeruvianPimaPolishPortuguesePotawatomiPuebloPuerto RicanPuget Sound SalishRomanianRussianSalvadoranSamoanScandinavianScotch-IrishScottishSeminoleSenegaleseSerbianShoshoneSierra LeoneanSiouxSlavicSlovakSloveneSomaliSouth AfricanSouth AmericanSouth American IndianSoviet UnionSpaniardSpanishSpanish AmericanSpanish American IndianSri LankanSubsaharan AfricanSudaneseSwedishSwissSyrianTaiwaneseThaiTlingit-HaidaTohono O'OdhamTonganTrinidadian and TobagonianTsimshianTurkishU.S. Virgin IslanderUgandanUkrainianUruguayanUteVenezuelanVietnameseWelshWest IndianYakamaYaquiYugoslavianYumanYup'ikZimbabwean
Immigration
NonimmigrantsImmigrantsAfghanistanAfricaAlbaniaArgentinaArmeniaAsiaAustraliaAustriaBahamasBangladeshBarbadosBelarusBelgiumBelizeBoliviaBosnia and HerzegovinaBrazilBulgariaBurma/MyanmarCabo VerdeCambodiaCameroonCanadaCaribbeanCentral AmericaChileChinaColombiaCongoCosta RicaCroatiaCubaCzechoslovakiaDenmarkDominicaDominican RepublicEastern AfricaEastern AsiaEastern EuropeEcuadorEgyptEl SalvadorEnglandEritreaEthiopiaEuropeFijiFranceGermanyGhanaGreeceGrenadaGuatemalaGuyanaHaitiHondurasHong KongHungaryIndiaIndonesiaIranIraqIrelandIsraelItalyJamaicaJapanJordanKazakhstanKenyaKoreaKuwaitLaosLatin AmericaLatviaLebanonLiberiaLithuaniaMalaysiaMexicoMicronesiaMiddle AfricaMoldovaMoroccoNepalNetherlandsNicaraguaNigeriaNorth AmericaNorth MacedoniaNorthern AfricaNorthern EuropeNorwayOceaniaPakistanPanamaPeruPhilippinesPolandPortugalRomaniaRussiaSaudi ArabiaScotlandSenegalSerbiaSierra LeoneSingaporeSomaliaSouth AfricaSouth AmericaSouth Central AsiaSouth Eastern AsiaSouthern EuropeSpainSri LankaSt. Vincent and the GrenadinesSudanSwedenSwitzerlandSyriaTaiwanThailandTrinidad and TobagoTurkeyUgandaUkraineUruguayUzbekistanVenezuelaVietnamWest IndiesWestern AfricaWestern AsiaWestern EuropeYemenZaireZimbabweAzores
Select to Compare
Race
Ancestry
AfghanAfricanAlaska NativeAlaskan AthabascanAlbanianAleutAlsatianAmericanApacheArabArapahoArgentineanArmenianAssyrian/Chaldean/SyriacAustralianAustrianBahamianBangladeshiBarbadianBasqueBelgianBelizeanBermudanBhutaneseBlackfeetBolivianBrazilianBritishBritish West IndianBulgarianBurmeseCajunCambodianCanadianCape VerdeanCarpatho RusynCelticCentral AmericanCentral American IndianCherokeeCheyenneChickasawChileanChineseChippewaChoctawColombianColvilleComancheCosta RicanCreeCreekCroatianCrowCubanCypriotCzechCzechoslovakianDanishDelawareDominicanDutchDutch West IndianEastern EuropeanEcuadorianEgyptianEnglishEstonianEthiopianEuropeanFijianFilipinoFinnishFrenchFrench American IndianFrench CanadianGermanGerman RussianGhanaianGreekGuamanian/ChamorroGuatemalanGuyaneseHaitianHmongHonduranHopiHoumaHungarianIcelanderIndian (Asian)IndonesianInupiatIranianIraqiIrishIroquoisIsraeliItalianJamaicanJapaneseJordanianKenyanKiowaKoreanLaotianLatvianLebaneseLiberianLithuanianLumbeeLuxembourgerMacedonianMalaysianMalteseMarshalleseMenomineeMexicanMexican American IndianMongolianMoroccanNative HawaiianNavajoNepaleseNew ZealanderNicaraguanNigerianNorthern EuropeanNorwegianOkinawanOsageOttawaPaiutePakistaniPalestinianPanamanianParaguayanPennsylvania GermanPeruvianPimaPolishPortuguesePotawatomiPuebloPuerto RicanPuget Sound SalishRomanianRussianSalvadoranSamoanScandinavianScotch-IrishScottishSeminoleSenegaleseSerbianShoshoneSierra LeoneanSiouxSlavicSlovakSloveneSomaliSouth AfricanSouth AmericanSouth American IndianSoviet UnionSpaniardSpanishSpanish AmericanSpanish American IndianSri LankanSubsaharan AfricanSudaneseSwedishSwissSyrianTaiwaneseThaiTlingit-HaidaTohono O'OdhamTonganTrinidadian and TobagonianTsimshianTurkishU.S. Virgin IslanderUgandanUkrainianUruguayanUteVenezuelanVietnameseWelshWest IndianYakamaYaquiYugoslavianYumanYup'ikZimbabwean
Immigration
NonimmigrantsImmigrantsAfghanistanAfricaAlbaniaArgentinaArmeniaAsiaAustraliaAustriaBahamasBangladeshBarbadosBelarusBelgiumBelizeBoliviaBosnia and HerzegovinaBrazilBulgariaBurma/MyanmarCabo VerdeCambodiaCameroonCanadaCaribbeanCentral AmericaChileChinaColombiaCongoCosta RicaCroatiaCubaCzechoslovakiaDenmarkDominicaDominican RepublicEastern AfricaEastern AsiaEastern EuropeEcuadorEgyptEl SalvadorEnglandEritreaEthiopiaEuropeFijiFranceGermanyGhanaGreeceGrenadaGuatemalaGuyanaHaitiHondurasHong KongHungaryIndiaIndonesiaIranIraqIrelandIsraelItalyJamaicaJapanJordanKazakhstanKenyaKoreaKuwaitLaosLatin AmericaLatviaLebanonLiberiaLithuaniaMalaysiaMexicoMicronesiaMiddle AfricaMoldovaMoroccoNepalNetherlandsNicaraguaNigeriaNorth AmericaNorth MacedoniaNorthern EuropeNorwayOceaniaPakistanPanamaPeruPhilippinesPolandPortugalRomaniaRussiaSaudi ArabiaScotlandSenegalSerbiaSierra LeoneSingaporeSomaliaSouth AfricaSouth AmericaSouth Central AsiaSouth Eastern AsiaSouthern EuropeSpainSri LankaSt. Vincent and the GrenadinesSudanSwedenSwitzerlandSyriaTaiwanThailandTrinidad and TobagoTurkeyUgandaUkraineUruguayUzbekistanVenezuelaVietnamWest IndiesWestern AfricaWestern AsiaWestern EuropeYemenZaireZimbabweAzores
4 or more Vehicles in Household
Income
Poverty
Unemployment
Labor Participation
Family Structure
Vehicle Availability
Education Level
Disability

Immigrants from Northern Africa 4 or more Vehicles in Household
Tragic

5.6%
4+ VEHICLES AVAILABLE
1.4/ 100
METRIC RATING
257th/ 347
METRIC RANK

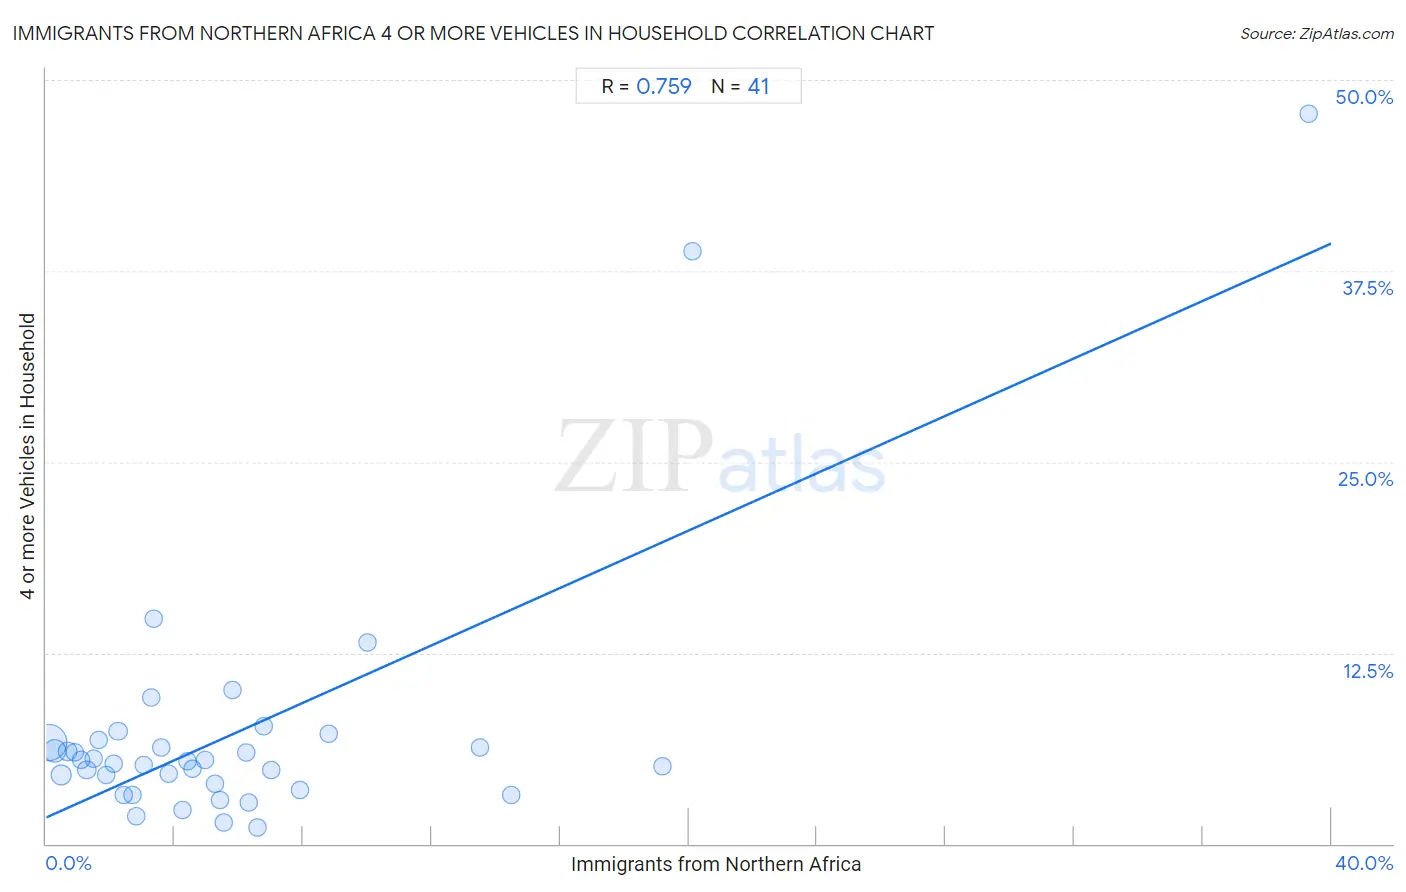
Immigrants from Northern Africa 4 or more Vehicles in Household Correlation Chart

The statistical analysis conducted on geographies consisting of 319,847,257 people shows a strong positive correlation between the proportion of Immigrants from Northern Africa and percentage of households with 4 or more vehicles available in the United States with a correlation coefficient (R) of 0.759 and weighted average of 5.6%. On average, for every 1% (one percent) increase in Immigrants from Northern Africa within a typical geography, there is an increase of 0.94% in percentage of households with 4 or more vehicles available.
Immigrants from Northern Africa 4 or more Vehicles in Household
It is essential to understand that the correlation between the percentage of Immigrants from Northern Africa and percentage of households with 4 or more vehicles available does not imply a direct cause-and-effect relationship. It remains uncertain whether the presence of Immigrants from Northern Africa influences an upward or downward trend in the level of percentage of households with 4 or more vehicles available within an area, or if Immigrants from Northern Africa simply ended up residing in those areas with higher or lower levels of percentage of households with 4 or more vehicles available due to other factors.

Demographics Similar to Immigrants from Northern Africa by 4 or more Vehicles in Household

In terms of 4 or more vehicles in household, the demographic groups most similar to Immigrants from Northern Africa are Immigrants from Turkey (5.7%, a difference of 0.080%), Yup'ik (5.7%, a difference of 0.12%), Immigrants from Lithuania (5.6%, a difference of 0.14%), Immigrants from France (5.6%, a difference of 0.17%), and Immigrants from Panama (5.7%, a difference of 0.20%).
DemographicsRating | Rank4 or more Vehicles in Household
Immigrants from Europe
2.3
/100
|
#250
Tragic
5.7%
Ugandans
2.2
/100
|
#251
Tragic
5.7%
Sub-Saharan Africans
2.1
/100
|
#252
Tragic
5.7%
Immigrants from Cuba
1.6
/100
|
#253
Tragic
5.7%
Immigrants from Panama
1.5
/100
|
#254
Tragic
5.7%
Yup'ik
1.5
/100
|
#255
Tragic
5.7%
Immigrants from Turkey
1.5
/100
|
#256
Tragic
5.7%
Immigrants from Northern Africa
1.4
/100
|
#257
Tragic
5.6%
Immigrants from Lithuania
1.4
/100
|
#258
Tragic
5.6%
Immigrants from France
1.3
/100
|
#259
Tragic
5.6%
Uruguayans
1.3
/100
|
#260
Tragic
5.6%
Sudanese
1.2
/100
|
#261
Tragic
5.6%
Bermudans
1.2
/100
|
#262
Tragic
5.6%
Immigrants from Saudi Arabia
1.1
/100
|
#263
Tragic
5.6%
Immigrants from Africa
1.0
/100
|
#264
Tragic
5.6%

Immigrants from Northern Africa 4 or more Vehicles in Household Correlation Summary

MeasurementImmigrants from Northern Africa Data4 or more Vehicles in Household Data
Minimum0.085%1.1%
Maximum39.3%47.8%
Range39.2%46.7%
Mean6.0%7.3%
Median4.2%5.4%
Interquartile 25% (IQ1)2.0%3.7%
Interquartile 75% (IQ3)6.7%6.7%
Interquartile Range (IQR)4.7%3.0%
Standard Deviation (Sample)7.1%8.7%
Standard Deviation (Population)7.0%8.6%

Correlation Details

Immigrants from Northern Africa PercentileSample Size4 or more Vehicles in Household
[
0.0%
-
0.5%
]
0.085%
202,724,6686.6%
[
0.0%
-
0.5%
]
0.27%
60,991,2146.1%
[
0.0%
-
0.5%
]
0.46%
28,638,3534.5%
[
0.5%
-
1.0%
]
0.67%
10,859,3756.0%
[
0.5%
-
1.0%
]
0.88%
5,052,6146.0%
[
1.0%
-
1.5%
]
1.09%
3,946,3965.5%
[
1.0%
-
1.5%
]
1.26%
2,404,8504.8%
[
1.0%
-
1.5%
]
1.48%
1,344,3445.6%
[
1.5%
-
2.0%
]
1.64%
798,8576.8%
[
1.5%
-
2.0%
]
1.86%
919,0404.5%
[
2.0%
-
2.5%
]
2.09%
220,9195.3%
[
2.0%
-
2.5%
]
2.24%
438,1357.4%
[
2.0%
-
2.5%
]
2.43%
163,1173.2%
[
2.5%
-
3.0%
]
2.70%
183,8543.2%
[
2.5%
-
3.0%
]
2.81%
388,9361.8%
[
3.0%
-
3.5%
]
3.04%
58,2675.2%
[
3.0%
-
3.5%
]
3.27%
58,8089.6%
[
3.0%
-
3.5%
]
3.35%
14,10214.7%
[
3.5%
-
4.0%
]
3.58%
24,4086.3%
[
3.5%
-
4.0%
]
3.80%
22,3244.6%
[
4.0%
-
4.5%
]
4.22%
47,3202.2%
[
4.0%
-
4.5%
]
4.41%
12,4245.4%
[
4.5%
-
5.0%
]
4.56%
33,6274.9%
[
4.5%
-
5.0%
]
4.96%
46,8875.5%
[
5.0%
-
5.5%
]
5.24%
223,5323.9%
[
5.0%
-
5.5%
]
5.41%
3,1622.8%
[
5.5%
-
6.0%
]
5.53%
51,6951.4%
[
5.5%
-
6.0%
]
5.80%
3,31310.1%
[
6.0%
-
6.5%
]
6.22%
8,8156.0%
[
6.0%
-
6.5%
]
6.32%
140,9942.7%
[
6.5%
-
7.0%
]
6.58%
5,0001.1%
[
6.5%
-
7.0%
]
6.76%
1487.7%
[
6.5%
-
7.0%
]
6.99%
1434.8%
[
7.5%
-
8.0%
]
7.90%
6,9383.5%
[
8.5%
-
9.0%
]
8.81%
1,3397.2%
[
10.0%
-
10.5%
]
10.02%
5,75113.1%
[
13.0%
-
13.5%
]
13.49%
1,3946.3%
[
14.0%
-
14.5%
]
14.46%
3323.2%
[
19.0%
-
19.5%
]
19.16%
9815.1%
[
20.0%
-
20.5%
]
20.12%
82538.8%
[
39.0%
-
39.5%
]
39.29%
5647.8%