Swiss 4 or more Vehicles in Household
COMPARE
Swiss
Select to Compare
4 or more Vehicles in Household
Swiss 4 or more Vehicles in Household
7.8%
4+ VEHICLES AVAILABLE
100.0/ 100
METRIC RATING
48th/ 347
METRIC RANK
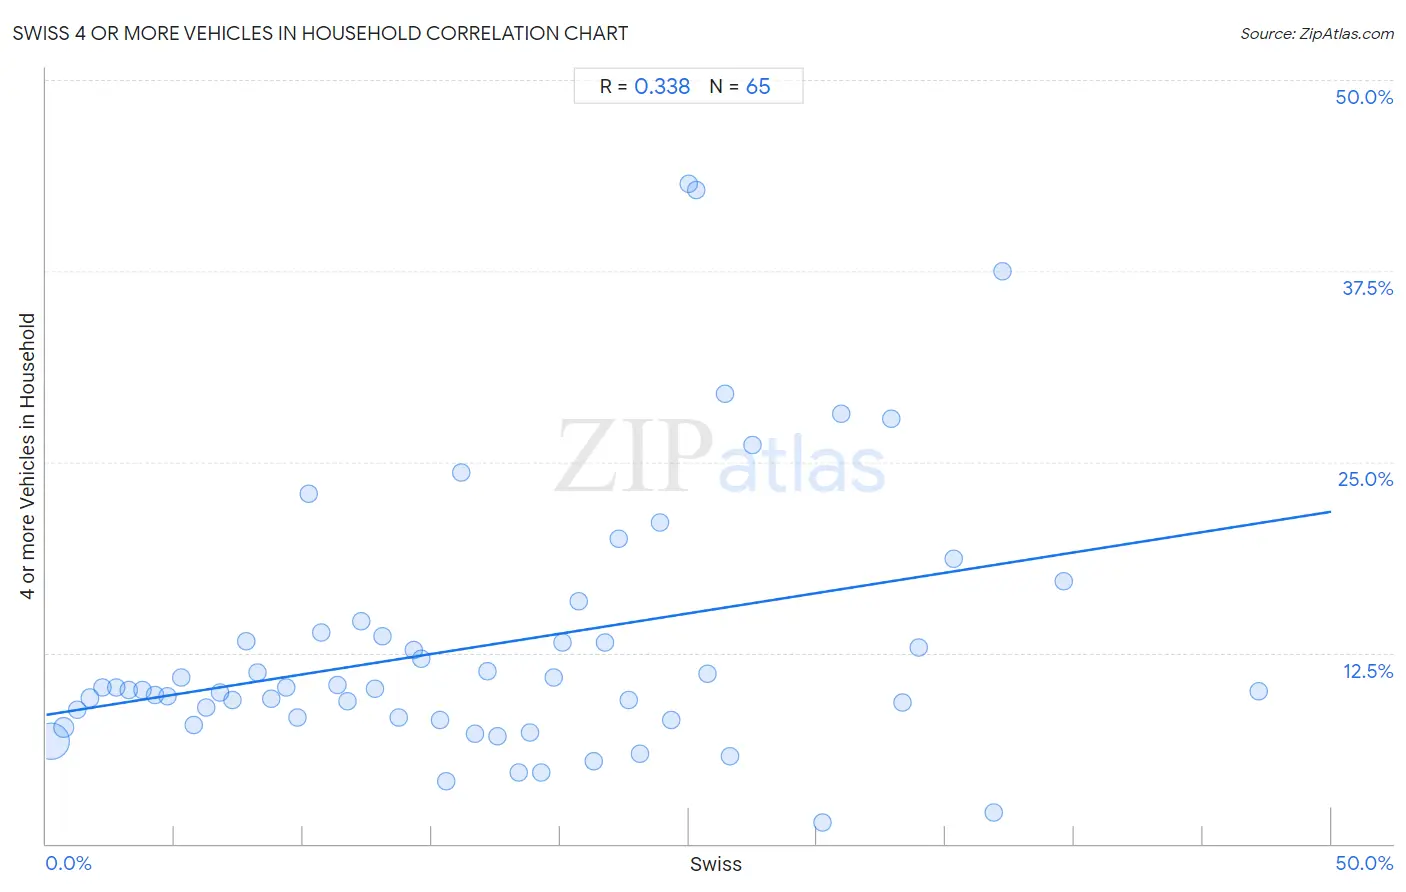
Swiss 4 or more Vehicles in Household Correlation Chart
The statistical analysis conducted on geographies consisting of 463,313,966 people shows a mild positive correlation between the proportion of Swiss and percentage of households with 4 or more vehicles available in the United States with a correlation coefficient (R) of 0.338 and weighted average of 7.8%. On average, for every 1% (one percent) increase in Swiss within a typical geography, there is an increase of 0.27% in percentage of households with 4 or more vehicles available.
It is essential to understand that the correlation between the percentage of Swiss and percentage of households with 4 or more vehicles available does not imply a direct cause-and-effect relationship. It remains uncertain whether the presence of Swiss influences an upward or downward trend in the level of percentage of households with 4 or more vehicles available within an area, or if Swiss simply ended up residing in those areas with higher or lower levels of percentage of households with 4 or more vehicles available due to other factors.
Demographics Similar to Swiss by 4 or more Vehicles in Household
In terms of 4 or more vehicles in household, the demographic groups most similar to Swiss are Osage (7.8%, a difference of 0.17%), Cherokee (7.7%, a difference of 0.19%), Crow (7.8%, a difference of 0.34%), Immigrants from El Salvador (7.7%, a difference of 0.35%), and Choctaw (7.8%, a difference of 0.51%).
| Demographics | Rating | Rank | 4 or more Vehicles in Household |
| Pima | 100.0 /100 | #41 | Exceptional 7.9% |
| Salvadorans | 100.0 /100 | #42 | Exceptional 7.8% |
| Fijians | 100.0 /100 | #43 | Exceptional 7.8% |
| Bhutanese | 100.0 /100 | #44 | Exceptional 7.8% |
| Choctaw | 100.0 /100 | #45 | Exceptional 7.8% |
| Crow | 100.0 /100 | #46 | Exceptional 7.8% |
| Osage | 100.0 /100 | #47 | Exceptional 7.8% |
| Swiss | 100.0 /100 | #48 | Exceptional 7.8% |
| Cherokee | 100.0 /100 | #49 | Exceptional 7.7% |
| Immigrants from El Salvador | 100.0 /100 | #50 | Exceptional 7.7% |
| Immigrants from Laos | 100.0 /100 | #51 | Exceptional 7.7% |
| Japanese | 100.0 /100 | #52 | Exceptional 7.7% |
| Malaysians | 100.0 /100 | #53 | Exceptional 7.7% |
| Dutch | 100.0 /100 | #54 | Exceptional 7.7% |
| Immigrants from Oceania | 100.0 /100 | #55 | Exceptional 7.6% |
Swiss 4 or more Vehicles in Household Correlation Summary
| Measurement | Swiss Data | 4 or more Vehicles in Household Data |
| Minimum | 0.18% | 1.4% |
| Maximum | 47.2% | 43.2% |
| Range | 47.0% | 41.8% |
| Mean | 17.1% | 13.0% |
| Median | 16.2% | 10.1% |
| Interquartile 25% (IQ1) | 8.0% | 8.2% |
| Interquartile 75% (IQ3) | 24.6% | 13.7% |
| Interquartile Range (IQR) | 16.6% | 5.5% |
| Standard Deviation (Sample) | 11.0% | 8.7% |
| Standard Deviation (Population) | 11.0% | 8.6% |
Correlation Details
| Swiss Percentile | Sample Size | 4 or more Vehicles in Household |
[ 0.0% - 0.5% ] 0.18% | 392,030,434 | 6.7% |
[ 0.5% - 1.0% ] 0.68% | 51,526,340 | 7.6% |
[ 1.0% - 1.5% ] 1.21% | 10,639,494 | 8.8% |
[ 1.5% - 2.0% ] 1.70% | 3,705,042 | 9.5% |
[ 2.0% - 2.5% ] 2.20% | 1,683,830 | 10.2% |
[ 2.5% - 3.0% ] 2.72% | 1,139,796 | 10.3% |
[ 3.0% - 3.5% ] 3.20% | 668,689 | 10.0% |
[ 3.5% - 4.0% ] 3.73% | 429,821 | 10.0% |
[ 4.0% - 4.5% ] 4.24% | 247,174 | 9.8% |
[ 4.5% - 5.0% ] 4.74% | 204,408 | 9.7% |
[ 5.0% - 5.5% ] 5.25% | 133,913 | 10.9% |
[ 5.5% - 6.0% ] 5.73% | 188,970 | 7.7% |
[ 6.0% - 6.5% ] 6.20% | 128,673 | 8.9% |
[ 6.5% - 7.0% ] 6.75% | 62,436 | 9.9% |
[ 7.0% - 7.5% ] 7.26% | 110,446 | 9.4% |
[ 7.5% - 8.0% ] 7.80% | 30,639 | 13.2% |
[ 8.0% - 8.5% ] 8.22% | 37,076 | 11.2% |
[ 8.5% - 9.0% ] 8.74% | 34,916 | 9.5% |
[ 9.0% - 9.5% ] 9.34% | 43,726 | 10.3% |
[ 9.5% - 10.0% ] 9.76% | 25,148 | 8.2% |
[ 10.0% - 10.5% ] 10.22% | 8,589 | 22.9% |
[ 10.5% - 11.0% ] 10.72% | 38,475 | 13.8% |
[ 11.0% - 11.5% ] 11.35% | 30,156 | 10.4% |
[ 11.5% - 12.0% ] 11.72% | 8,215 | 9.3% |
[ 12.0% - 12.5% ] 12.28% | 10,784 | 14.6% |
[ 12.5% - 13.0% ] 12.79% | 10,082 | 10.1% |
[ 13.0% - 13.5% ] 13.10% | 8,728 | 13.6% |
[ 13.5% - 14.0% ] 13.72% | 10,966 | 8.3% |
[ 14.0% - 14.5% ] 14.28% | 6,854 | 12.7% |
[ 14.5% - 15.0% ] 14.60% | 8,199 | 12.1% |
[ 15.0% - 15.5% ] 15.31% | 9,691 | 8.1% |
[ 15.5% - 16.0% ] 15.57% | 4,786 | 4.1% |
[ 16.0% - 16.5% ] 16.17% | 2,047 | 24.3% |
[ 16.5% - 17.0% ] 16.67% | 8,894 | 7.2% |
[ 17.0% - 17.5% ] 17.18% | 1,100 | 11.3% |
[ 17.5% - 18.0% ] 17.58% | 3,266 | 7.0% |
[ 18.0% - 18.5% ] 18.36% | 12,706 | 4.7% |
[ 18.5% - 19.0% ] 18.82% | 15,165 | 7.3% |
[ 19.0% - 19.5% ] 19.26% | 2,965 | 4.6% |
[ 19.5% - 20.0% ] 19.73% | 12,795 | 10.8% |
[ 20.0% - 20.5% ] 20.11% | 5,072 | 13.2% |
[ 20.5% - 21.0% ] 20.74% | 2,237 | 15.9% |
[ 21.0% - 21.5% ] 21.30% | 784 | 5.4% |
[ 21.5% - 22.0% ] 21.75% | 3,489 | 13.2% |
[ 22.0% - 22.5% ] 22.28% | 368 | 20.0% |
[ 22.5% - 23.0% ] 22.66% | 128 | 9.4% |
[ 23.0% - 23.5% ] 23.12% | 1,514 | 5.9% |
[ 23.5% - 24.0% ] 23.90% | 3,151 | 21.1% |
[ 24.0% - 24.5% ] 24.30% | 461 | 8.1% |
[ 25.0% - 25.5% ] 25.00% | 320 | 43.2% |
[ 25.0% - 25.5% ] 25.29% | 601 | 42.8% |
[ 25.5% - 26.0% ] 25.73% | 2,274 | 11.1% |
[ 26.0% - 26.5% ] 26.39% | 1,023 | 29.4% |
[ 26.5% - 27.0% ] 26.61% | 1,135 | 5.7% |
[ 27.0% - 27.5% ] 27.50% | 80 | 26.1% |
[ 30.0% - 30.5% ] 30.18% | 222 | 1.4% |
[ 30.5% - 31.0% ] 30.94% | 278 | 28.1% |
[ 32.5% - 33.0% ] 32.88% | 222 | 27.8% |
[ 33.0% - 33.5% ] 33.33% | 279 | 9.3% |
[ 33.5% - 34.0% ] 33.95% | 1,302 | 12.9% |
[ 35.0% - 35.5% ] 35.32% | 201 | 18.6% |
[ 36.5% - 37.0% ] 36.87% | 651 | 2.1% |
[ 37.0% - 37.5% ] 37.20% | 2,016 | 37.5% |
[ 39.5% - 40.0% ] 39.60% | 404 | 17.2% |
[ 47.0% - 47.5% ] 47.19% | 320 | 10.0% |