Northern European 4 or more Vehicles in Household

COMPARE

Northern European
Race
Ancestry
AfghanAfricanAlaska NativeAlaskan AthabascanAlbanianAleutAlsatianAmericanApacheArabArapahoArgentineanArmenianAssyrian/Chaldean/SyriacAustralianAustrianBahamianBangladeshiBarbadianBasqueBelgianBelizeanBermudanBhutaneseBlackfeetBolivianBrazilianBritishBritish West IndianBulgarianBurmeseCajunCambodianCanadianCape VerdeanCarpatho RusynCelticCentral AmericanCentral American IndianCherokeeCheyenneChickasawChileanChineseChippewaChoctawColombianColvilleComancheCosta RicanCreeCreekCroatianCrowCubanCypriotCzechCzechoslovakianDanishDelawareDominicanDutchDutch West IndianEastern EuropeanEcuadorianEgyptianEnglishEstonianEthiopianEuropeanFijianFilipinoFinnishFrenchFrench American IndianFrench CanadianGermanGerman RussianGhanaianGreekGuamanian/ChamorroGuatemalanGuyaneseHaitianHmongHonduranHopiHoumaHungarianIcelanderIndian (Asian)IndonesianInupiatIranianIraqiIrishIroquoisIsraeliItalianJamaicanJapaneseJordanianKenyanKiowaKoreanLaotianLatvianLebaneseLiberianLithuanianLumbeeLuxembourgerMacedonianMalaysianMalteseMarshalleseMenomineeMexicanMexican American IndianMongolianMoroccanNative HawaiianNavajoNepaleseNew ZealanderNicaraguanNigerianNorthern EuropeanNorwegianOkinawanOsageOttawaPaiutePakistaniPalestinianPanamanianParaguayanPennsylvania GermanPeruvianPimaPolishPortuguesePotawatomiPuebloPuerto RicanPuget Sound SalishRomanianRussianSalvadoranSamoanScandinavianScotch-IrishScottishSeminoleSenegaleseSerbianShoshoneSierra LeoneanSiouxSlavicSlovakSloveneSomaliSouth AfricanSouth AmericanSouth American IndianSoviet UnionSpaniardSpanishSpanish AmericanSpanish American IndianSri LankanSubsaharan AfricanSudaneseSwedishSwissSyrianTaiwaneseThaiTlingit-HaidaTohono O'OdhamTonganTrinidadian and TobagonianTsimshianTurkishU.S. Virgin IslanderUgandanUkrainianUruguayanUteVenezuelanVietnameseWelshWest IndianYakamaYaquiYugoslavianYumanYup'ikZimbabwean
Immigration
NonimmigrantsImmigrantsAfghanistanAfricaAlbaniaArgentinaArmeniaAsiaAustraliaAustriaBahamasBangladeshBarbadosBelarusBelgiumBelizeBoliviaBosnia and HerzegovinaBrazilBulgariaBurma/MyanmarCabo VerdeCambodiaCameroonCanadaCaribbeanCentral AmericaChileChinaColombiaCongoCosta RicaCroatiaCubaCzechoslovakiaDenmarkDominicaDominican RepublicEastern AfricaEastern AsiaEastern EuropeEcuadorEgyptEl SalvadorEnglandEritreaEthiopiaEuropeFijiFranceGermanyGhanaGreeceGrenadaGuatemalaGuyanaHaitiHondurasHong KongHungaryIndiaIndonesiaIranIraqIrelandIsraelItalyJamaicaJapanJordanKazakhstanKenyaKoreaKuwaitLaosLatin AmericaLatviaLebanonLiberiaLithuaniaMalaysiaMexicoMicronesiaMiddle AfricaMoldovaMoroccoNepalNetherlandsNicaraguaNigeriaNorth AmericaNorth MacedoniaNorthern AfricaNorthern EuropeNorwayOceaniaPakistanPanamaPeruPhilippinesPolandPortugalRomaniaRussiaSaudi ArabiaScotlandSenegalSerbiaSierra LeoneSingaporeSomaliaSouth AfricaSouth AmericaSouth Central AsiaSouth Eastern AsiaSouthern EuropeSpainSri LankaSt. Vincent and the GrenadinesSudanSwedenSwitzerlandSyriaTaiwanThailandTrinidad and TobagoTurkeyUgandaUkraineUruguayUzbekistanVenezuelaVietnamWest IndiesWestern AfricaWestern AsiaWestern EuropeYemenZaireZimbabweAzores
Select to Compare
Race
Ancestry
AfghanAfricanAlaska NativeAlaskan AthabascanAlbanianAleutAlsatianAmericanApacheArabArapahoArgentineanArmenianAssyrian/Chaldean/SyriacAustralianAustrianBahamianBangladeshiBarbadianBasqueBelgianBelizeanBermudanBhutaneseBlackfeetBolivianBrazilianBritishBritish West IndianBulgarianBurmeseCajunCambodianCanadianCape VerdeanCarpatho RusynCelticCentral AmericanCentral American IndianCherokeeCheyenneChickasawChileanChineseChippewaChoctawColombianColvilleComancheCosta RicanCreeCreekCroatianCrowCubanCypriotCzechCzechoslovakianDanishDelawareDominicanDutchDutch West IndianEastern EuropeanEcuadorianEgyptianEnglishEstonianEthiopianEuropeanFijianFilipinoFinnishFrenchFrench American IndianFrench CanadianGermanGerman RussianGhanaianGreekGuamanian/ChamorroGuatemalanGuyaneseHaitianHmongHonduranHopiHoumaHungarianIcelanderIndian (Asian)IndonesianInupiatIranianIraqiIrishIroquoisIsraeliItalianJamaicanJapaneseJordanianKenyanKiowaKoreanLaotianLatvianLebaneseLiberianLithuanianLumbeeLuxembourgerMacedonianMalaysianMalteseMarshalleseMenomineeMexicanMexican American IndianMongolianMoroccanNative HawaiianNavajoNepaleseNew ZealanderNicaraguanNigerianNorwegianOkinawanOsageOttawaPaiutePakistaniPalestinianPanamanianParaguayanPennsylvania GermanPeruvianPimaPolishPortuguesePotawatomiPuebloPuerto RicanPuget Sound SalishRomanianRussianSalvadoranSamoanScandinavianScotch-IrishScottishSeminoleSenegaleseSerbianShoshoneSierra LeoneanSiouxSlavicSlovakSloveneSomaliSouth AfricanSouth AmericanSouth American IndianSoviet UnionSpaniardSpanishSpanish AmericanSpanish American IndianSri LankanSubsaharan AfricanSudaneseSwedishSwissSyrianTaiwaneseThaiTlingit-HaidaTohono O'OdhamTonganTrinidadian and TobagonianTsimshianTurkishU.S. Virgin IslanderUgandanUkrainianUruguayanUteVenezuelanVietnameseWelshWest IndianYakamaYaquiYugoslavianYumanYup'ikZimbabwean
Immigration
NonimmigrantsImmigrantsAfghanistanAfricaAlbaniaArgentinaArmeniaAsiaAustraliaAustriaBahamasBangladeshBarbadosBelarusBelgiumBelizeBoliviaBosnia and HerzegovinaBrazilBulgariaBurma/MyanmarCabo VerdeCambodiaCameroonCanadaCaribbeanCentral AmericaChileChinaColombiaCongoCosta RicaCroatiaCubaCzechoslovakiaDenmarkDominicaDominican RepublicEastern AfricaEastern AsiaEastern EuropeEcuadorEgyptEl SalvadorEnglandEritreaEthiopiaEuropeFijiFranceGermanyGhanaGreeceGrenadaGuatemalaGuyanaHaitiHondurasHong KongHungaryIndiaIndonesiaIranIraqIrelandIsraelItalyJamaicaJapanJordanKazakhstanKenyaKoreaKuwaitLaosLatin AmericaLatviaLebanonLiberiaLithuaniaMalaysiaMexicoMicronesiaMiddle AfricaMoldovaMoroccoNepalNetherlandsNicaraguaNigeriaNorth AmericaNorth MacedoniaNorthern AfricaNorthern EuropeNorwayOceaniaPakistanPanamaPeruPhilippinesPolandPortugalRomaniaRussiaSaudi ArabiaScotlandSenegalSerbiaSierra LeoneSingaporeSomaliaSouth AfricaSouth AmericaSouth Central AsiaSouth Eastern AsiaSouthern EuropeSpainSri LankaSt. Vincent and the GrenadinesSudanSwedenSwitzerlandSyriaTaiwanThailandTrinidad and TobagoTurkeyUgandaUkraineUruguayUzbekistanVenezuelaVietnamWest IndiesWestern AfricaWestern AsiaWestern EuropeYemenZaireZimbabweAzores
4 or more Vehicles in Household
Income
Poverty
Unemployment
Labor Participation
Family Structure
Vehicle Availability
Education Level
Disability

Northern European 4 or more Vehicles in Household
Exceptional

7.3%
4+ VEHICLES AVAILABLE
99.8/ 100
METRIC RATING
82nd/ 347
METRIC RANK

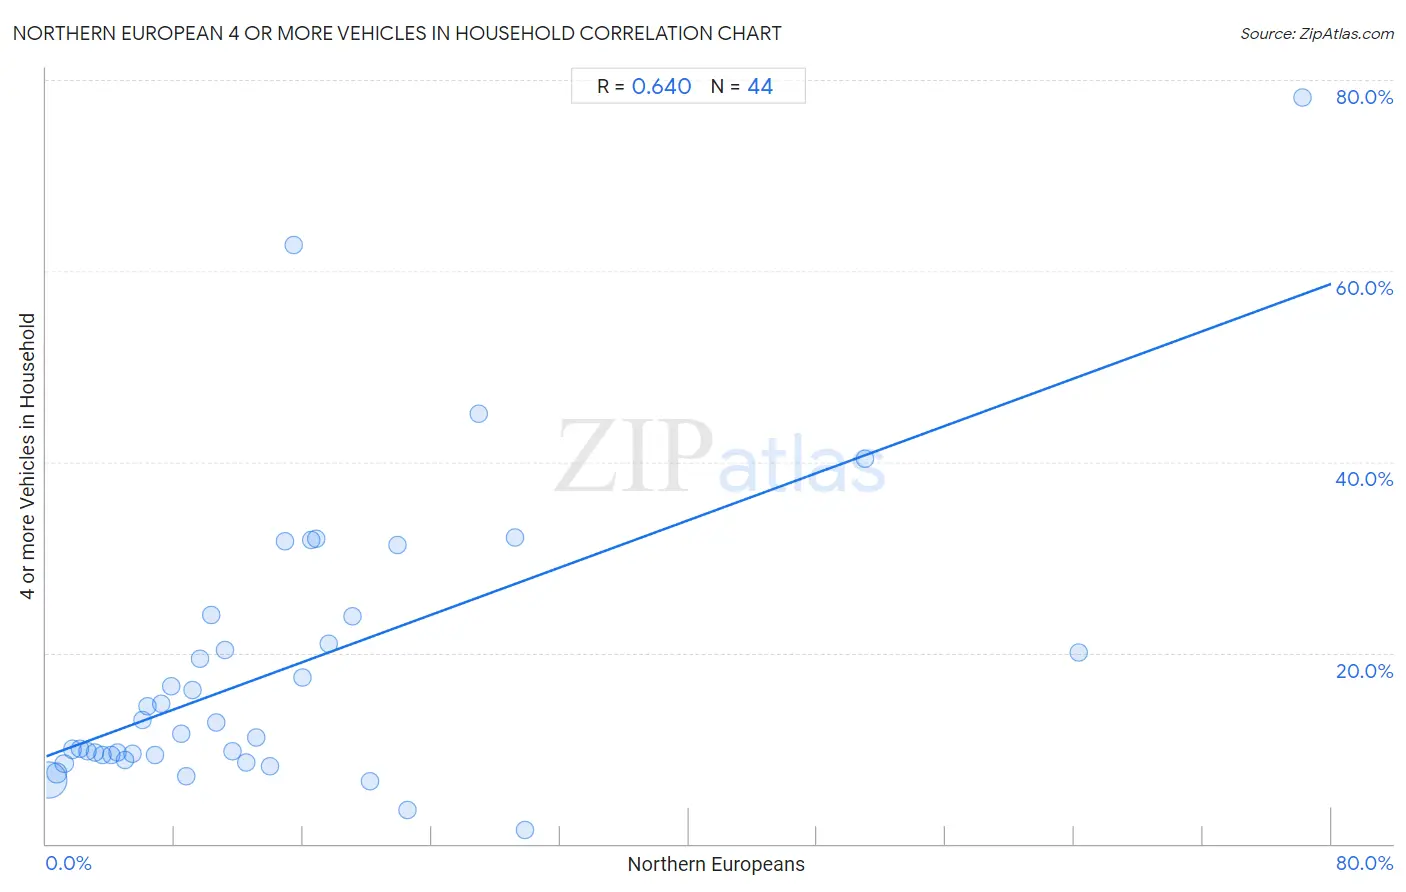
Northern European 4 or more Vehicles in Household Correlation Chart

The statistical analysis conducted on geographies consisting of 404,763,195 people shows a significant positive correlation between the proportion of Northern Europeans and percentage of households with 4 or more vehicles available in the United States with a correlation coefficient (R) of 0.640 and weighted average of 7.3%. On average, for every 1% (one percent) increase in Northern Europeans within a typical geography, there is an increase of 0.62% in percentage of households with 4 or more vehicles available.
Northern European 4 or more Vehicles in Household
It is essential to understand that the correlation between the percentage of Northern Europeans and percentage of households with 4 or more vehicles available does not imply a direct cause-and-effect relationship. It remains uncertain whether the presence of Northern Europeans influences an upward or downward trend in the level of percentage of households with 4 or more vehicles available within an area, or if Northern Europeans simply ended up residing in those areas with higher or lower levels of percentage of households with 4 or more vehicles available due to other factors.

Demographics Similar to Northern Europeans by 4 or more Vehicles in Household

In terms of 4 or more vehicles in household, the demographic groups most similar to Northern Europeans are Potawatomi (7.3%, a difference of 0.12%), Finnish (7.3%, a difference of 0.20%), Afghan (7.3%, a difference of 0.44%), Cree (7.2%, a difference of 0.61%), and Alaska Native (7.3%, a difference of 0.76%).
DemographicsRating | Rank4 or more Vehicles in Household
Immigrants from Cambodia
99.9
/100
|
#75
Exceptional
7.4%
Laotians
99.9
/100
|
#76
Exceptional
7.4%
Apache
99.9
/100
|
#77
Exceptional
7.4%
Whites/Caucasians
99.8
/100
|
#78
Exceptional
7.4%
Czechs
99.8
/100
|
#79
Exceptional
7.4%
Alaska Natives
99.8
/100
|
#80
Exceptional
7.3%
Finns
99.8
/100
|
#81
Exceptional
7.3%
Northern Europeans
99.8
/100
|
#82
Exceptional
7.3%
Potawatomi
99.7
/100
|
#83
Exceptional
7.3%
Afghans
99.7
/100
|
#84
Exceptional
7.3%
Cree
99.7
/100
|
#85
Exceptional
7.2%
Immigrants from Indonesia
99.6
/100
|
#86
Exceptional
7.2%
Delaware
99.6
/100
|
#87
Exceptional
7.2%
Nonimmigrants
99.6
/100
|
#88
Exceptional
7.2%
British
99.6
/100
|
#89
Exceptional
7.2%

Northern European 4 or more Vehicles in Household Correlation Summary

MeasurementNorthern European Data4 or more Vehicles in Household Data
Minimum0.15%1.5%
Maximum78.2%78.2%
Range78.1%76.8%
Mean14.7%18.3%
Median10.4%12.1%
Interquartile 25% (IQ1)5.1%9.3%
Interquartile 75% (IQ3)17.2%22.4%
Interquartile Range (IQR)12.1%13.2%
Standard Deviation (Sample)15.9%15.3%
Standard Deviation (Population)15.7%15.2%

Correlation Details

Northern European PercentileSample Size4 or more Vehicles in Household
[
0.0%
-
0.5%
]
0.15%
365,485,9586.7%
[
0.5%
-
1.0%
]
0.64%
31,156,4897.4%
[
1.0%
-
1.5%
]
1.12%
5,013,9158.4%
[
1.5%
-
2.0%
]
1.60%
1,786,7719.9%
[
2.0%
-
2.5%
]
2.09%
506,8699.9%
[
2.5%
-
3.0%
]
2.55%
270,2879.7%
[
3.0%
-
3.5%
]
3.07%
148,4529.5%
[
3.5%
-
4.0%
]
3.54%
131,5269.3%
[
4.0%
-
4.5%
]
4.08%
97,2349.2%
[
4.0%
-
4.5%
]
4.46%
32,8689.6%
[
4.5%
-
5.0%
]
4.90%
40,0298.7%
[
5.0%
-
5.5%
]
5.37%
32,7999.4%
[
5.5%
-
6.0%
]
5.97%
7,24013.0%
[
6.0%
-
6.5%
]
6.34%
4,08714.4%
[
6.5%
-
7.0%
]
6.78%
8,7919.3%
[
7.0%
-
7.5%
]
7.19%
4,89414.7%
[
7.5%
-
8.0%
]
7.82%
1,76516.6%
[
8.0%
-
8.5%
]
8.39%
4,31411.5%
[
8.5%
-
9.0%
]
8.74%
4,4647.1%
[
9.0%
-
9.5%
]
9.07%
2,81016.1%
[
9.5%
-
10.0%
]
9.61%
2,36219.4%
[
10.0%
-
10.5%
]
10.30%
33024.0%
[
10.5%
-
11.0%
]
10.57%
3,12112.7%
[
11.0%
-
11.5%
]
11.10%
3,15320.3%
[
11.5%
-
12.0%
]
11.56%
2,5779.7%
[
12.0%
-
12.5%
]
12.49%
9618.5%
[
13.0%
-
13.5%
]
13.06%
31411.1%
[
13.5%
-
14.0%
]
13.94%
4168.1%
[
14.5%
-
15.0%
]
14.83%
34431.7%
[
15.0%
-
15.5%
]
15.38%
15662.7%
[
15.5%
-
16.0%
]
15.93%
1,06717.4%
[
16.0%
-
16.5%
]
16.50%
1,37031.9%
[
16.5%
-
17.0%
]
16.84%
9532.0%
[
17.5%
-
18.0%
]
17.61%
1,19821.0%
[
19.0%
-
19.5%
]
19.06%
85523.9%
[
20.0%
-
20.5%
]
20.14%
4226.6%
[
21.5%
-
22.0%
]
21.89%
23331.3%
[
22.0%
-
22.5%
]
22.47%
1,2863.5%
[
26.5%
-
27.0%
]
26.92%
7845.0%
[
29.0%
-
29.5%
]
29.20%
56532.0%
[
29.5%
-
30.0%
]
29.83%
3521.5%
[
50.5%
-
51.0%
]
50.95%
26340.3%
[
64.0%
-
64.5%
]
64.29%
1420.0%
[
78.0%
-
78.5%
]
78.22%
10178.2%