Mexican American Indian 4 or more Vehicles in Household
COMPARE
Mexican American Indian
Select to Compare
4 or more Vehicles in Household
Mexican American Indian 4 or more Vehicles in Household
8.4%
4+ VEHICLES AVAILABLE
100.0/ 100
METRIC RATING
26th/ 347
METRIC RANK
Mexican American Indian 4 or more Vehicles in Household Correlation Chart
The statistical analysis conducted on geographies consisting of 316,602,557 people shows a poor positive correlation between the proportion of Mexican American Indians and percentage of households with 4 or more vehicles available in the United States with a correlation coefficient (R) of 0.161 and weighted average of 8.4%. On average, for every 1% (one percent) increase in Mexican American Indians within a typical geography, there is an increase of 0.086% in percentage of households with 4 or more vehicles available.
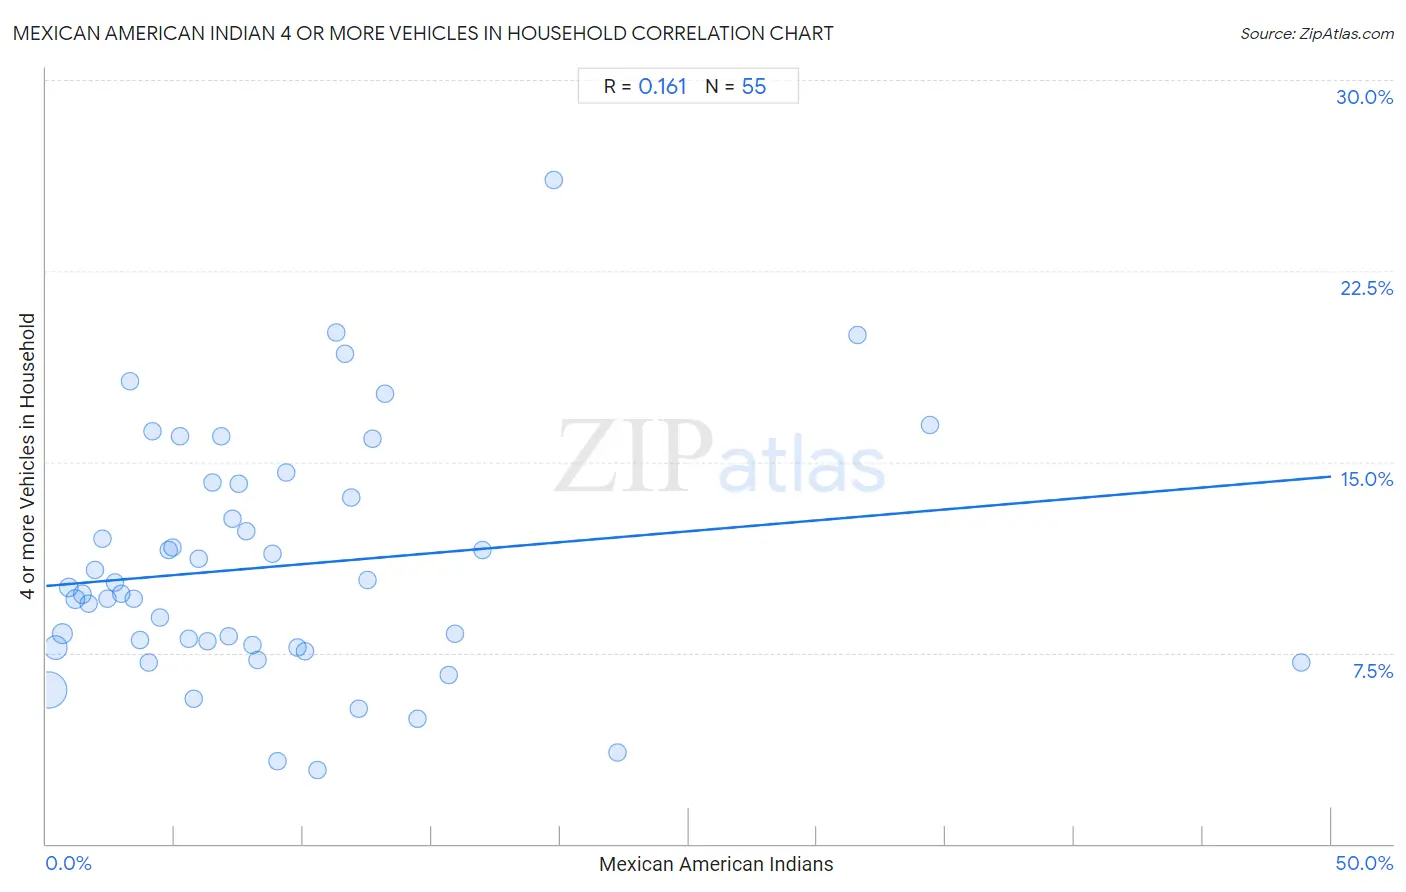
It is essential to understand that the correlation between the percentage of Mexican American Indians and percentage of households with 4 or more vehicles available does not imply a direct cause-and-effect relationship. It remains uncertain whether the presence of Mexican American Indians influences an upward or downward trend in the level of percentage of households with 4 or more vehicles available within an area, or if Mexican American Indians simply ended up residing in those areas with higher or lower levels of percentage of households with 4 or more vehicles available due to other factors.
Demographics Similar to Mexican American Indians by 4 or more Vehicles in Household
In terms of 4 or more vehicles in household, the demographic groups most similar to Mexican American Indians are Sri Lankan (8.4%, a difference of 0.12%), Basque (8.4%, a difference of 0.31%), Immigrants from Central America (8.5%, a difference of 0.86%), Cheyenne (8.3%, a difference of 1.5%), and Immigrants from Philippines (8.5%, a difference of 1.7%).
| Demographics | Rating | Rank | 4 or more Vehicles in Household |
| Koreans | 100.0 /100 | #19 | Exceptional 8.6% |
| Pueblo | 100.0 /100 | #20 | Exceptional 8.6% |
| Danes | 100.0 /100 | #21 | Exceptional 8.6% |
| Immigrants from Vietnam | 100.0 /100 | #22 | Exceptional 8.6% |
| Immigrants from Philippines | 100.0 /100 | #23 | Exceptional 8.5% |
| Immigrants from Central America | 100.0 /100 | #24 | Exceptional 8.5% |
| Basques | 100.0 /100 | #25 | Exceptional 8.4% |
| Mexican American Indians | 100.0 /100 | #26 | Exceptional 8.4% |
| Sri Lankans | 100.0 /100 | #27 | Exceptional 8.4% |
| Cheyenne | 100.0 /100 | #28 | Exceptional 8.3% |
| Immigrants from South Eastern Asia | 100.0 /100 | #29 | Exceptional 8.2% |
| Navajo | 100.0 /100 | #30 | Exceptional 8.2% |
| Natives/Alaskans | 100.0 /100 | #31 | Exceptional 8.2% |
| Marshallese | 100.0 /100 | #32 | Exceptional 8.1% |
| Yaqui | 100.0 /100 | #33 | Exceptional 8.1% |
Mexican American Indian 4 or more Vehicles in Household Correlation Summary
| Measurement | Mexican American Indian Data | 4 or more Vehicles in Household Data |
| Minimum | 0.10% | 2.9% |
| Maximum | 48.8% | 26.1% |
| Range | 48.7% | 23.2% |
| Mean | 9.1% | 10.9% |
| Median | 7.1% | 9.8% |
| Interquartile 25% (IQ1) | 3.4% | 7.7% |
| Interquartile 75% (IQ3) | 11.9% | 14.1% |
| Interquartile Range (IQR) | 8.5% | 6.4% |
| Standard Deviation (Sample) | 8.9% | 4.7% |
| Standard Deviation (Population) | 8.8% | 4.7% |
Correlation Details
| Mexican American Indian Percentile | Sample Size | 4 or more Vehicles in Household |
[ 0.0% - 0.5% ] 0.10% | 196,990,000 | 6.0% |
[ 0.0% - 0.5% ] 0.37% | 63,552,681 | 7.7% |
[ 0.5% - 1.0% ] 0.62% | 27,959,566 | 8.3% |
[ 0.5% - 1.0% ] 0.87% | 13,550,299 | 10.1% |
[ 1.0% - 1.5% ] 1.13% | 5,257,643 | 9.6% |
[ 1.0% - 1.5% ] 1.40% | 2,945,443 | 9.8% |
[ 1.5% - 2.0% ] 1.64% | 2,353,959 | 9.4% |
[ 1.5% - 2.0% ] 1.89% | 1,213,302 | 10.7% |
[ 2.0% - 2.5% ] 2.17% | 914,157 | 12.0% |
[ 2.0% - 2.5% ] 2.39% | 492,283 | 9.6% |
[ 2.5% - 3.0% ] 2.67% | 327,431 | 10.3% |
[ 2.5% - 3.0% ] 2.93% | 112,190 | 9.8% |
[ 3.0% - 3.5% ] 3.24% | 328,033 | 18.2% |
[ 3.0% - 3.5% ] 3.42% | 122,479 | 9.6% |
[ 3.5% - 4.0% ] 3.65% | 100,935 | 8.0% |
[ 3.5% - 4.0% ] 3.99% | 103,191 | 7.1% |
[ 4.0% - 4.5% ] 4.14% | 19,042 | 16.2% |
[ 4.0% - 4.5% ] 4.43% | 30,504 | 8.9% |
[ 4.5% - 5.0% ] 4.77% | 21,719 | 11.5% |
[ 4.5% - 5.0% ] 4.93% | 13,928 | 11.6% |
[ 5.0% - 5.5% ] 5.19% | 36,842 | 16.0% |
[ 5.5% - 6.0% ] 5.53% | 14,099 | 8.1% |
[ 5.5% - 6.0% ] 5.72% | 2,762 | 5.7% |
[ 5.5% - 6.0% ] 5.91% | 18,079 | 11.2% |
[ 6.0% - 6.5% ] 6.28% | 13,355 | 8.0% |
[ 6.0% - 6.5% ] 6.45% | 11,493 | 14.2% |
[ 6.5% - 7.0% ] 6.79% | 7,742 | 16.0% |
[ 7.0% - 7.5% ] 7.09% | 23,650 | 8.1% |
[ 7.0% - 7.5% ] 7.24% | 5,163 | 12.7% |
[ 7.0% - 7.5% ] 7.49% | 2,909 | 14.1% |
[ 7.5% - 8.0% ] 7.79% | 9,657 | 12.3% |
[ 8.0% - 8.5% ] 8.01% | 9,363 | 7.8% |
[ 8.0% - 8.5% ] 8.24% | 6,274 | 7.2% |
[ 8.5% - 9.0% ] 8.82% | 2,506 | 11.4% |
[ 9.0% - 9.5% ] 9.02% | 5,409 | 3.2% |
[ 9.0% - 9.5% ] 9.33% | 3,203 | 14.6% |
[ 9.5% - 10.0% ] 9.80% | 1,817 | 7.7% |
[ 10.0% - 10.5% ] 10.05% | 4,526 | 7.6% |
[ 10.5% - 11.0% ] 10.56% | 322 | 2.9% |
[ 11.0% - 11.5% ] 11.28% | 727 | 20.1% |
[ 11.5% - 12.0% ] 11.64% | 507 | 19.2% |
[ 11.5% - 12.0% ] 11.88% | 2,777 | 13.6% |
[ 12.0% - 12.5% ] 12.15% | 650 | 5.3% |
[ 12.0% - 12.5% ] 12.48% | 2,756 | 10.4% |
[ 12.5% - 13.0% ] 12.71% | 118 | 15.9% |
[ 13.0% - 13.5% ] 13.17% | 3,242 | 17.7% |
[ 14.0% - 14.5% ] 14.47% | 159 | 4.9% |
[ 15.5% - 16.0% ] 15.65% | 1,438 | 6.6% |
[ 15.5% - 16.0% ] 15.93% | 1,036 | 8.3% |
[ 16.5% - 17.0% ] 16.96% | 112 | 11.5% |
[ 19.5% - 20.0% ] 19.77% | 86 | 26.1% |
[ 22.0% - 22.5% ] 22.22% | 54 | 3.6% |
[ 31.5% - 32.0% ] 31.58% | 95 | 20.0% |
[ 34.0% - 34.5% ] 34.41% | 590 | 16.4% |
[ 48.5% - 49.0% ] 48.82% | 254 | 7.1% |