Immigrants from Eastern Europe 4 or more Vehicles in Household
COMPARE
Immigrants from Eastern Europe
Select to Compare
4 or more Vehicles in Household
Immigrants from Eastern Europe 4 or more Vehicles in Household
5.4%
4+ VEHICLES AVAILABLE
0.4/ 100
METRIC RATING
278th/ 347
METRIC RANK
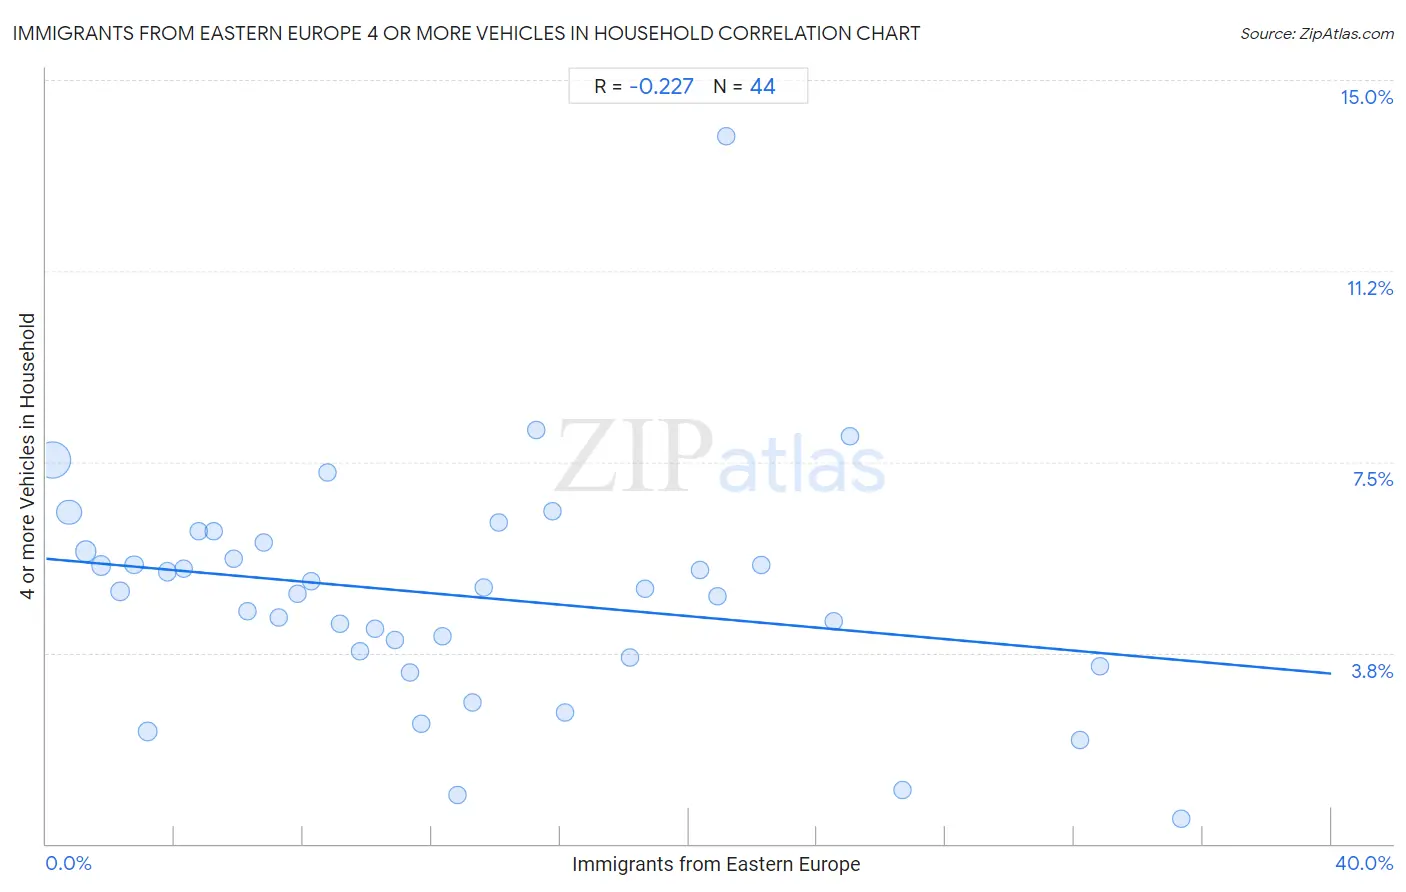
Immigrants from Eastern Europe 4 or more Vehicles in Household Correlation Chart
The statistical analysis conducted on geographies consisting of 473,333,841 people shows a weak negative correlation between the proportion of Immigrants from Eastern Europe and percentage of households with 4 or more vehicles available in the United States with a correlation coefficient (R) of -0.227 and weighted average of 5.4%. On average, for every 1% (one percent) increase in Immigrants from Eastern Europe within a typical geography, there is a decrease of 0.056% in percentage of households with 4 or more vehicles available.
It is essential to understand that the correlation between the percentage of Immigrants from Eastern Europe and percentage of households with 4 or more vehicles available does not imply a direct cause-and-effect relationship. It remains uncertain whether the presence of Immigrants from Eastern Europe influences an upward or downward trend in the level of percentage of households with 4 or more vehicles available within an area, or if Immigrants from Eastern Europe simply ended up residing in those areas with higher or lower levels of percentage of households with 4 or more vehicles available due to other factors.
Demographics Similar to Immigrants from Eastern Europe by 4 or more Vehicles in Household
In terms of 4 or more vehicles in household, the demographic groups most similar to Immigrants from Eastern Europe are Immigrants from Uruguay (5.4%, a difference of 0.46%), Alsatian (5.4%, a difference of 0.47%), Immigrants from Western Africa (5.4%, a difference of 0.54%), Immigrants from Spain (5.4%, a difference of 0.71%), and Immigrants from Ireland (5.4%, a difference of 0.79%).
| Demographics | Rating | Rank | 4 or more Vehicles in Household |
| Immigrants from Sudan | 0.6 /100 | #271 | Tragic 5.5% |
| Immigrants from Kazakhstan | 0.6 /100 | #272 | Tragic 5.5% |
| Macedonians | 0.6 /100 | #273 | Tragic 5.5% |
| Blacks/African Americans | 0.6 /100 | #274 | Tragic 5.5% |
| Cambodians | 0.5 /100 | #275 | Tragic 5.5% |
| Immigrants from Latvia | 0.5 /100 | #276 | Tragic 5.5% |
| Immigrants from Bulgaria | 0.5 /100 | #277 | Tragic 5.5% |
| Immigrants from Eastern Europe | 0.4 /100 | #278 | Tragic 5.4% |
| Immigrants from Uruguay | 0.3 /100 | #279 | Tragic 5.4% |
| Alsatians | 0.3 /100 | #280 | Tragic 5.4% |
| Immigrants from Western Africa | 0.3 /100 | #281 | Tragic 5.4% |
| Immigrants from Spain | 0.3 /100 | #282 | Tragic 5.4% |
| Immigrants from Ireland | 0.3 /100 | #283 | Tragic 5.4% |
| Brazilians | 0.3 /100 | #284 | Tragic 5.4% |
| Immigrants from Liberia | 0.2 /100 | #285 | Tragic 5.4% |
Immigrants from Eastern Europe 4 or more Vehicles in Household Correlation Summary
| Measurement | Immigrants from Eastern Europe Data | 4 or more Vehicles in Household Data |
| Minimum | 0.21% | 0.50% |
| Maximum | 35.3% | 13.9% |
| Range | 35.1% | 13.4% |
| Mean | 12.6% | 4.9% |
| Median | 11.1% | 5.0% |
| Interquartile 25% (IQ1) | 5.5% | 3.7% |
| Interquartile 75% (IQ3) | 18.4% | 5.8% |
| Interquartile Range (IQR) | 12.9% | 2.1% |
| Standard Deviation (Sample) | 9.1% | 2.3% |
| Standard Deviation (Population) | 9.0% | 2.2% |
Correlation Details
| Immigrants from Eastern Europe Percentile | Sample Size | 4 or more Vehicles in Household |
[ 0.0% - 0.5% ] 0.21% | 262,385,284 | 7.5% |
[ 0.5% - 1.0% ] 0.72% | 95,039,882 | 6.5% |
[ 1.0% - 1.5% ] 1.23% | 47,231,217 | 5.7% |
[ 1.5% - 2.0% ] 1.73% | 20,230,749 | 5.5% |
[ 2.0% - 2.5% ] 2.29% | 14,643,257 | 4.9% |
[ 2.5% - 3.0% ] 2.74% | 6,849,280 | 5.5% |
[ 3.0% - 3.5% ] 3.16% | 12,301,800 | 2.2% |
[ 3.5% - 4.0% ] 3.76% | 3,419,008 | 5.3% |
[ 4.0% - 4.5% ] 4.27% | 2,635,723 | 5.4% |
[ 4.5% - 5.0% ] 4.74% | 1,598,963 | 6.1% |
[ 5.0% - 5.5% ] 5.20% | 1,064,871 | 6.1% |
[ 5.5% - 6.0% ] 5.82% | 767,178 | 5.6% |
[ 6.0% - 6.5% ] 6.26% | 785,648 | 4.6% |
[ 6.5% - 7.0% ] 6.76% | 446,855 | 5.9% |
[ 7.0% - 7.5% ] 7.23% | 405,929 | 4.4% |
[ 7.5% - 8.0% ] 7.80% | 368,828 | 4.9% |
[ 8.0% - 8.5% ] 8.24% | 373,962 | 5.2% |
[ 8.5% - 9.0% ] 8.75% | 33,186 | 7.3% |
[ 9.0% - 9.5% ] 9.14% | 240,620 | 4.3% |
[ 9.5% - 10.0% ] 9.76% | 244,482 | 3.8% |
[ 10.0% - 10.5% ] 10.24% | 352,943 | 4.2% |
[ 10.5% - 11.0% ] 10.86% | 411,316 | 4.0% |
[ 11.0% - 11.5% ] 11.33% | 135,918 | 3.4% |
[ 11.5% - 12.0% ] 11.66% | 163,921 | 2.4% |
[ 12.0% - 12.5% ] 12.35% | 234,799 | 4.1% |
[ 12.5% - 13.0% ] 12.81% | 108,487 | 0.95% |
[ 13.0% - 13.5% ] 13.25% | 79,100 | 2.8% |
[ 13.5% - 14.0% ] 13.63% | 202,448 | 5.0% |
[ 14.0% - 14.5% ] 14.08% | 44,527 | 6.3% |
[ 15.0% - 15.5% ] 15.26% | 21,064 | 8.1% |
[ 15.5% - 16.0% ] 15.75% | 29,743 | 6.5% |
[ 16.0% - 16.5% ] 16.13% | 153,198 | 2.6% |
[ 18.0% - 18.5% ] 18.18% | 65,901 | 3.7% |
[ 18.5% - 19.0% ] 18.64% | 30,080 | 5.0% |
[ 20.0% - 20.5% ] 20.33% | 1,864 | 5.4% |
[ 20.5% - 21.0% ] 20.89% | 15,393 | 4.9% |
[ 21.0% - 21.5% ] 21.18% | 1,539 | 13.9% |
[ 22.0% - 22.5% ] 22.24% | 26,108 | 5.5% |
[ 24.5% - 25.0% ] 24.50% | 8,942 | 4.4% |
[ 25.0% - 25.5% ] 25.01% | 23,200 | 8.0% |
[ 26.5% - 27.0% ] 26.66% | 47,893 | 1.1% |
[ 32.0% - 32.5% ] 32.16% | 1,990 | 2.0% |
[ 32.5% - 33.0% ] 32.78% | 23,676 | 3.5% |
[ 35.0% - 35.5% ] 35.35% | 83,069 | 0.50% |