Kiowa 4 or more Vehicles in Household
COMPARE
Kiowa
Select to Compare
4 or more Vehicles in Household
Kiowa 4 or more Vehicles in Household
6.2%
4+ VEHICLES AVAILABLE
34.7/ 100
METRIC RATING
188th/ 347
METRIC RANK
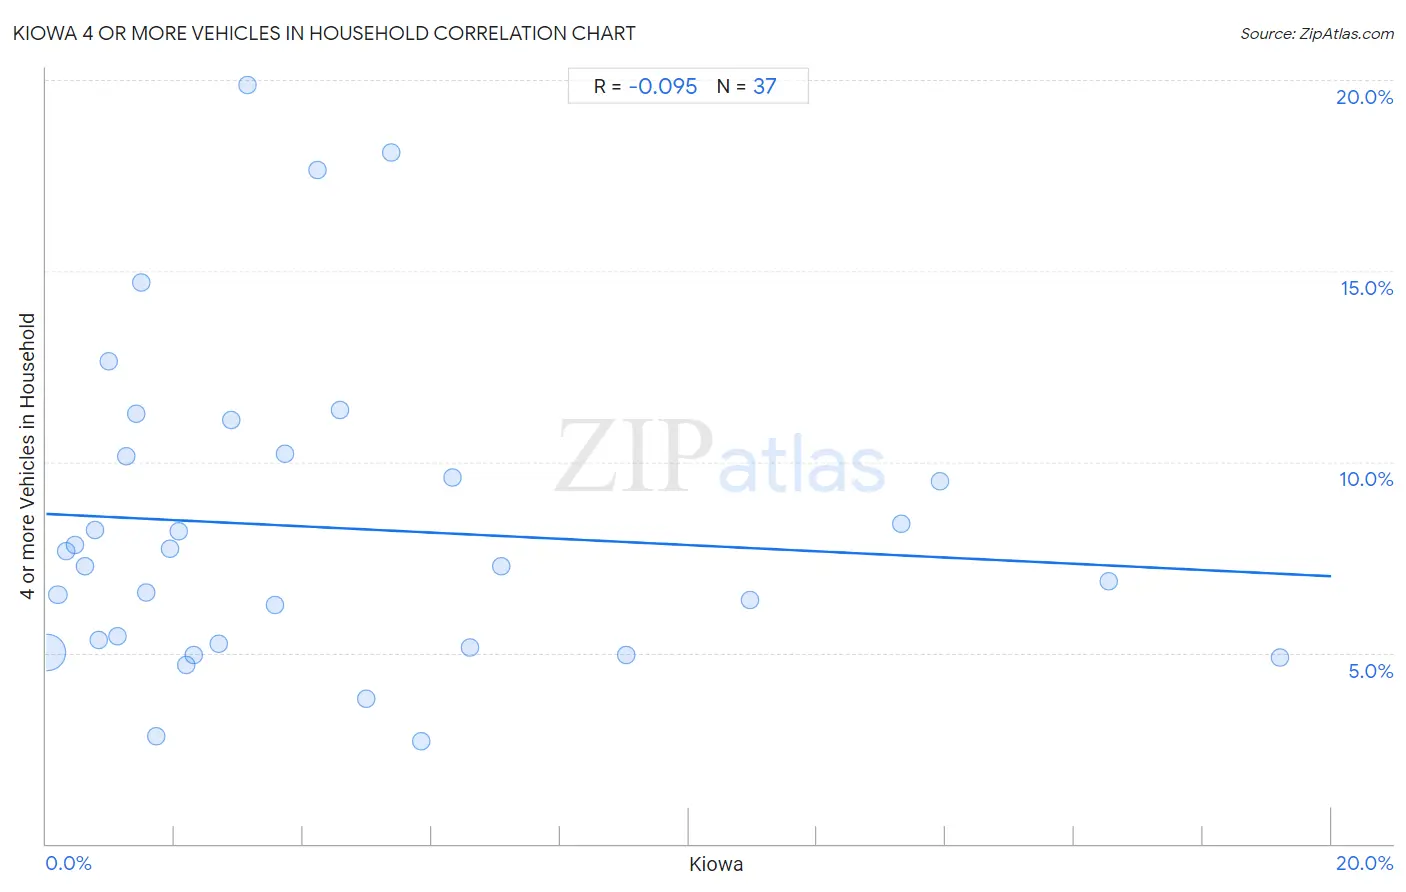
Kiowa 4 or more Vehicles in Household Correlation Chart
The statistical analysis conducted on geographies consisting of 56,082,422 people shows a slight negative correlation between the proportion of Kiowa and percentage of households with 4 or more vehicles available in the United States with a correlation coefficient (R) of -0.095 and weighted average of 6.2%. On average, for every 1% (one percent) increase in Kiowa within a typical geography, there is a decrease of 0.082% in percentage of households with 4 or more vehicles available.
It is essential to understand that the correlation between the percentage of Kiowa and percentage of households with 4 or more vehicles available does not imply a direct cause-and-effect relationship. It remains uncertain whether the presence of Kiowa influences an upward or downward trend in the level of percentage of households with 4 or more vehicles available within an area, or if Kiowa simply ended up residing in those areas with higher or lower levels of percentage of households with 4 or more vehicles available due to other factors.
Demographics Similar to Kiowa by 4 or more Vehicles in Household
In terms of 4 or more vehicles in household, the demographic groups most similar to Kiowa are Immigrants from South Africa (6.2%, a difference of 0.070%), Immigrants from Eastern Asia (6.2%, a difference of 0.17%), Immigrants from Northern Europe (6.2%, a difference of 0.23%), Thai (6.2%, a difference of 0.25%), and Iraqi (6.2%, a difference of 0.29%).
| Demographics | Rating | Rank | 4 or more Vehicles in Household |
| Yugoslavians | 41.1 /100 | #181 | Average 6.3% |
| South American Indians | 40.7 /100 | #182 | Average 6.3% |
| Immigrants from Burma/Myanmar | 37.5 /100 | #183 | Fair 6.2% |
| Iraqis | 37.3 /100 | #184 | Fair 6.2% |
| Thais | 36.9 /100 | #185 | Fair 6.2% |
| Immigrants from Northern Europe | 36.8 /100 | #186 | Fair 6.2% |
| Immigrants from South Africa | 35.4 /100 | #187 | Fair 6.2% |
| Kiowa | 34.7 /100 | #188 | Fair 6.2% |
| Immigrants from Eastern Asia | 33.3 /100 | #189 | Fair 6.2% |
| South Africans | 32.2 /100 | #190 | Fair 6.2% |
| Inupiat | 30.7 /100 | #191 | Fair 6.2% |
| Romanians | 30.7 /100 | #192 | Fair 6.2% |
| Immigrants from Kuwait | 28.0 /100 | #193 | Fair 6.2% |
| Immigrants from Sweden | 27.0 /100 | #194 | Fair 6.2% |
| Argentineans | 27.0 /100 | #195 | Fair 6.2% |
Kiowa 4 or more Vehicles in Household Correlation Summary
| Measurement | Kiowa Data | 4 or more Vehicles in Household Data |
| Minimum | 0.014% | 2.7% |
| Maximum | 19.2% | 19.9% |
| Range | 19.2% | 17.2% |
| Mean | 4.5% | 8.3% |
| Median | 2.7% | 7.3% |
| Interquartile 25% (IQ1) | 1.2% | 5.2% |
| Interquartile 75% (IQ3) | 6.1% | 10.2% |
| Interquartile Range (IQR) | 4.9% | 5.0% |
| Standard Deviation (Sample) | 4.8% | 4.1% |
| Standard Deviation (Population) | 4.7% | 4.1% |
Correlation Details
| Kiowa Percentile | Sample Size | 4 or more Vehicles in Household |
[ 0.0% - 0.5% ] 0.014% | 53,191,054 | 5.0% |
[ 0.0% - 0.5% ] 0.18% | 1,500,206 | 6.5% |
[ 0.0% - 0.5% ] 0.31% | 603,478 | 7.6% |
[ 0.0% - 0.5% ] 0.45% | 326,136 | 7.8% |
[ 0.5% - 1.0% ] 0.60% | 91,763 | 7.3% |
[ 0.5% - 1.0% ] 0.75% | 43,569 | 8.2% |
[ 0.5% - 1.0% ] 0.82% | 111,877 | 5.3% |
[ 0.5% - 1.0% ] 0.98% | 3,059 | 12.6% |
[ 1.0% - 1.5% ] 1.11% | 117,253 | 5.4% |
[ 1.0% - 1.5% ] 1.25% | 9,363 | 10.1% |
[ 1.0% - 1.5% ] 1.41% | 1,493 | 11.3% |
[ 1.0% - 1.5% ] 1.47% | 4,747 | 14.7% |
[ 1.5% - 2.0% ] 1.57% | 21,911 | 6.6% |
[ 1.5% - 2.0% ] 1.70% | 176 | 2.8% |
[ 1.5% - 2.0% ] 1.92% | 22,810 | 7.7% |
[ 2.0% - 2.5% ] 2.07% | 1,065 | 8.2% |
[ 2.0% - 2.5% ] 2.17% | 1,196 | 4.7% |
[ 2.0% - 2.5% ] 2.29% | 1,613 | 4.9% |
[ 2.5% - 3.0% ] 2.68% | 783 | 5.2% |
[ 2.5% - 3.0% ] 2.88% | 800 | 11.1% |
[ 3.0% - 3.5% ] 3.14% | 542 | 19.9% |
[ 3.5% - 4.0% ] 3.56% | 478 | 6.2% |
[ 3.5% - 4.0% ] 3.72% | 1,613 | 10.2% |
[ 4.0% - 4.5% ] 4.22% | 166 | 17.6% |
[ 4.5% - 5.0% ] 4.58% | 961 | 11.4% |
[ 4.5% - 5.0% ] 4.97% | 1,207 | 3.8% |
[ 5.0% - 5.5% ] 5.36% | 373 | 18.1% |
[ 5.5% - 6.0% ] 5.83% | 240 | 2.7% |
[ 6.0% - 6.5% ] 6.32% | 1,377 | 9.6% |
[ 6.5% - 7.0% ] 6.59% | 1,154 | 5.1% |
[ 7.0% - 7.5% ] 7.08% | 1,526 | 7.3% |
[ 9.0% - 9.5% ] 9.02% | 499 | 5.0% |
[ 10.5% - 11.0% ] 10.96% | 292 | 6.4% |
[ 13.0% - 13.5% ] 13.31% | 1,585 | 8.4% |
[ 13.5% - 14.0% ] 13.91% | 2,301 | 9.5% |
[ 16.5% - 17.0% ] 16.54% | 8,033 | 6.9% |
[ 19.0% - 19.5% ] 19.20% | 5,723 | 4.9% |