Immigrants from Egypt 4 or more Vehicles in Household

COMPARE

Immigrants from Egypt
Race
Ancestry
AfghanAfricanAlaska NativeAlaskan AthabascanAlbanianAleutAlsatianAmericanApacheArabArapahoArgentineanArmenianAssyrian/Chaldean/SyriacAustralianAustrianBahamianBangladeshiBarbadianBasqueBelgianBelizeanBermudanBhutaneseBlackfeetBolivianBrazilianBritishBritish West IndianBulgarianBurmeseCajunCambodianCanadianCape VerdeanCarpatho RusynCelticCentral AmericanCentral American IndianCherokeeCheyenneChickasawChileanChineseChippewaChoctawColombianColvilleComancheCosta RicanCreeCreekCroatianCrowCubanCypriotCzechCzechoslovakianDanishDelawareDominicanDutchDutch West IndianEastern EuropeanEcuadorianEgyptianEnglishEstonianEthiopianEuropeanFijianFilipinoFinnishFrenchFrench American IndianFrench CanadianGermanGerman RussianGhanaianGreekGuamanian/ChamorroGuatemalanGuyaneseHaitianHmongHonduranHopiHoumaHungarianIcelanderIndian (Asian)IndonesianInupiatIranianIraqiIrishIroquoisIsraeliItalianJamaicanJapaneseJordanianKenyanKiowaKoreanLaotianLatvianLebaneseLiberianLithuanianLumbeeLuxembourgerMacedonianMalaysianMalteseMarshalleseMenomineeMexicanMexican American IndianMongolianMoroccanNative HawaiianNavajoNepaleseNew ZealanderNicaraguanNigerianNorthern EuropeanNorwegianOkinawanOsageOttawaPaiutePakistaniPalestinianPanamanianParaguayanPennsylvania GermanPeruvianPimaPolishPortuguesePotawatomiPuebloPuerto RicanPuget Sound SalishRomanianRussianSalvadoranSamoanScandinavianScotch-IrishScottishSeminoleSenegaleseSerbianShoshoneSierra LeoneanSiouxSlavicSlovakSloveneSomaliSouth AfricanSouth AmericanSouth American IndianSoviet UnionSpaniardSpanishSpanish AmericanSpanish American IndianSri LankanSubsaharan AfricanSudaneseSwedishSwissSyrianTaiwaneseThaiTlingit-HaidaTohono O'OdhamTonganTrinidadian and TobagonianTsimshianTurkishU.S. Virgin IslanderUgandanUkrainianUruguayanUteVenezuelanVietnameseWelshWest IndianYakamaYaquiYugoslavianYumanYup'ikZimbabwean
Immigration
NonimmigrantsImmigrantsAfghanistanAfricaAlbaniaArgentinaArmeniaAsiaAustraliaAustriaBahamasBangladeshBarbadosBelarusBelgiumBelizeBoliviaBosnia and HerzegovinaBrazilBulgariaBurma/MyanmarCabo VerdeCambodiaCameroonCanadaCaribbeanCentral AmericaChileChinaColombiaCongoCosta RicaCroatiaCubaCzechoslovakiaDenmarkDominicaDominican RepublicEastern AfricaEastern AsiaEastern EuropeEcuadorEgyptEl SalvadorEnglandEritreaEthiopiaEuropeFijiFranceGermanyGhanaGreeceGrenadaGuatemalaGuyanaHaitiHondurasHong KongHungaryIndiaIndonesiaIranIraqIrelandIsraelItalyJamaicaJapanJordanKazakhstanKenyaKoreaKuwaitLaosLatin AmericaLatviaLebanonLiberiaLithuaniaMalaysiaMexicoMicronesiaMiddle AfricaMoldovaMoroccoNepalNetherlandsNicaraguaNigeriaNorth AmericaNorth MacedoniaNorthern AfricaNorthern EuropeNorwayOceaniaPakistanPanamaPeruPhilippinesPolandPortugalRomaniaRussiaSaudi ArabiaScotlandSenegalSerbiaSierra LeoneSingaporeSomaliaSouth AfricaSouth AmericaSouth Central AsiaSouth Eastern AsiaSouthern EuropeSpainSri LankaSt. Vincent and the GrenadinesSudanSwedenSwitzerlandSyriaTaiwanThailandTrinidad and TobagoTurkeyUgandaUkraineUruguayUzbekistanVenezuelaVietnamWest IndiesWestern AfricaWestern AsiaWestern EuropeYemenZaireZimbabweAzores
Select to Compare
Race
Ancestry
AfghanAfricanAlaska NativeAlaskan AthabascanAlbanianAleutAlsatianAmericanApacheArabArapahoArgentineanArmenianAssyrian/Chaldean/SyriacAustralianAustrianBahamianBangladeshiBarbadianBasqueBelgianBelizeanBermudanBhutaneseBlackfeetBolivianBrazilianBritishBritish West IndianBulgarianBurmeseCajunCambodianCanadianCape VerdeanCarpatho RusynCelticCentral AmericanCentral American IndianCherokeeCheyenneChickasawChileanChineseChippewaChoctawColombianColvilleComancheCosta RicanCreeCreekCroatianCrowCubanCypriotCzechCzechoslovakianDanishDelawareDominicanDutchDutch West IndianEastern EuropeanEcuadorianEgyptianEnglishEstonianEthiopianEuropeanFijianFilipinoFinnishFrenchFrench American IndianFrench CanadianGermanGerman RussianGhanaianGreekGuamanian/ChamorroGuatemalanGuyaneseHaitianHmongHonduranHopiHoumaHungarianIcelanderIndian (Asian)IndonesianInupiatIranianIraqiIrishIroquoisIsraeliItalianJamaicanJapaneseJordanianKenyanKiowaKoreanLaotianLatvianLebaneseLiberianLithuanianLumbeeLuxembourgerMacedonianMalaysianMalteseMarshalleseMenomineeMexicanMexican American IndianMongolianMoroccanNative HawaiianNavajoNepaleseNew ZealanderNicaraguanNigerianNorthern EuropeanNorwegianOkinawanOsageOttawaPaiutePakistaniPalestinianPanamanianParaguayanPennsylvania GermanPeruvianPimaPolishPortuguesePotawatomiPuebloPuerto RicanPuget Sound SalishRomanianRussianSalvadoranSamoanScandinavianScotch-IrishScottishSeminoleSenegaleseSerbianShoshoneSierra LeoneanSiouxSlavicSlovakSloveneSomaliSouth AfricanSouth AmericanSouth American IndianSoviet UnionSpaniardSpanishSpanish AmericanSpanish American IndianSri LankanSubsaharan AfricanSudaneseSwedishSwissSyrianTaiwaneseThaiTlingit-HaidaTohono O'OdhamTonganTrinidadian and TobagonianTsimshianTurkishU.S. Virgin IslanderUgandanUkrainianUruguayanUteVenezuelanVietnameseWelshWest IndianYakamaYaquiYugoslavianYumanYup'ikZimbabwean
Immigration
NonimmigrantsImmigrantsAfghanistanAfricaAlbaniaArgentinaArmeniaAsiaAustraliaAustriaBahamasBangladeshBarbadosBelarusBelgiumBelizeBoliviaBosnia and HerzegovinaBrazilBulgariaBurma/MyanmarCabo VerdeCambodiaCameroonCanadaCaribbeanCentral AmericaChileChinaColombiaCongoCosta RicaCroatiaCubaCzechoslovakiaDenmarkDominicaDominican RepublicEastern AfricaEastern AsiaEastern EuropeEcuadorEl SalvadorEnglandEritreaEthiopiaEuropeFijiFranceGermanyGhanaGreeceGrenadaGuatemalaGuyanaHaitiHondurasHong KongHungaryIndiaIndonesiaIranIraqIrelandIsraelItalyJamaicaJapanJordanKazakhstanKenyaKoreaKuwaitLaosLatin AmericaLatviaLebanonLiberiaLithuaniaMalaysiaMexicoMicronesiaMiddle AfricaMoldovaMoroccoNepalNetherlandsNicaraguaNigeriaNorth AmericaNorth MacedoniaNorthern AfricaNorthern EuropeNorwayOceaniaPakistanPanamaPeruPhilippinesPolandPortugalRomaniaRussiaSaudi ArabiaScotlandSenegalSerbiaSierra LeoneSingaporeSomaliaSouth AfricaSouth AmericaSouth Central AsiaSouth Eastern AsiaSouthern EuropeSpainSri LankaSt. Vincent and the GrenadinesSudanSwedenSwitzerlandSyriaTaiwanThailandTrinidad and TobagoTurkeyUgandaUkraineUruguayUzbekistanVenezuelaVietnamWest IndiesWestern AfricaWestern AsiaWestern EuropeYemenZaireZimbabweAzores
4 or more Vehicles in Household
Income
Poverty
Unemployment
Labor Participation
Family Structure
Vehicle Availability
Education Level
Disability

Immigrants from Egypt 4 or more Vehicles in Household
Poor

6.0%
4+ VEHICLES AVAILABLE
14.7/ 100
METRIC RATING
212th/ 347
METRIC RANK

Immigrants from Egypt 4 or more Vehicles in Household Correlation Chart

The statistical analysis conducted on geographies consisting of 244,625,690 people shows a strong positive correlation between the proportion of Immigrants from Egypt and percentage of households with 4 or more vehicles available in the United States with a correlation coefficient (R) of 0.714 and weighted average of 6.0%. On average, for every 1% (one percent) increase in Immigrants from Egypt within a typical geography, there is an increase of 0.83% in percentage of households with 4 or more vehicles available.
Immigrants from Egypt 4 or more Vehicles in Household
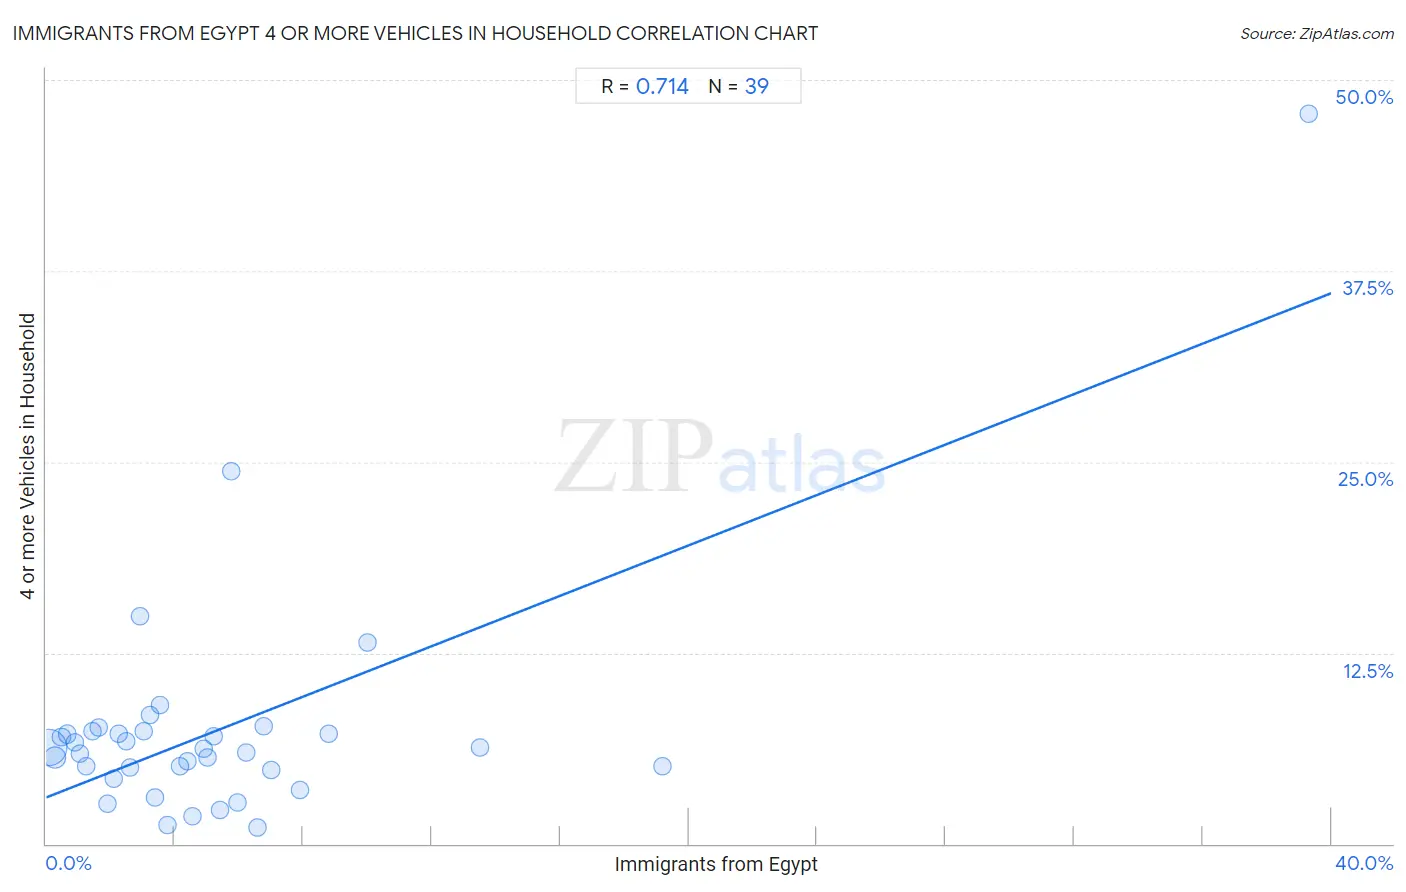
It is essential to understand that the correlation between the percentage of Immigrants from Egypt and percentage of households with 4 or more vehicles available does not imply a direct cause-and-effect relationship. It remains uncertain whether the presence of Immigrants from Egypt influences an upward or downward trend in the level of percentage of households with 4 or more vehicles available within an area, or if Immigrants from Egypt simply ended up residing in those areas with higher or lower levels of percentage of households with 4 or more vehicles available due to other factors.

Demographics Similar to Immigrants from Egypt by 4 or more Vehicles in Household

In terms of 4 or more vehicles in household, the demographic groups most similar to Immigrants from Egypt are Panamanian (6.0%, a difference of 0.020%), Arab (6.0%, a difference of 0.060%), Immigrants from Austria (6.0%, a difference of 0.080%), Immigrants from Zimbabwe (6.0%, a difference of 0.10%), and Immigrants from Honduras (6.1%, a difference of 0.15%).
DemographicsRating | Rank4 or more Vehicles in Household
Hondurans
19.3
/100
|
#205
Poor
6.1%
Kenyans
18.5
/100
|
#206
Poor
6.1%
Immigrants from Chile
16.9
/100
|
#207
Poor
6.1%
Immigrants from Nigeria
15.6
/100
|
#208
Poor
6.1%
Immigrants from Honduras
15.4
/100
|
#209
Poor
6.1%
Immigrants from Zimbabwe
15.1
/100
|
#210
Poor
6.0%
Panamanians
14.8
/100
|
#211
Poor
6.0%
Immigrants from Egypt
14.7
/100
|
#212
Poor
6.0%
Arabs
14.4
/100
|
#213
Poor
6.0%
Immigrants from Austria
14.3
/100
|
#214
Poor
6.0%
Immigrants from China
13.8
/100
|
#215
Poor
6.0%
Immigrants from Romania
13.8
/100
|
#216
Poor
6.0%
Nigerians
12.2
/100
|
#217
Poor
6.0%
Immigrants from Italy
11.0
/100
|
#218
Poor
6.0%
Serbians
11.0
/100
|
#219
Poor
6.0%

Immigrants from Egypt 4 or more Vehicles in Household Correlation Summary

MeasurementImmigrants from Egypt Data4 or more Vehicles in Household Data
Minimum0.064%1.1%
Maximum39.3%47.8%
Range39.2%46.7%
Mean5.4%7.5%
Median3.8%6.2%
Interquartile 25% (IQ1)1.9%4.8%
Interquartile 75% (IQ3)6.2%7.3%
Interquartile Range (IQR)4.3%2.5%
Standard Deviation (Sample)6.7%7.8%
Standard Deviation (Population)6.6%7.7%

Correlation Details

Immigrants from Egypt PercentileSample Size4 or more Vehicles in Household
[
0.0%
-
0.5%
]
0.064%
186,186,4356.3%
[
0.0%
-
0.5%
]
0.27%
36,850,8805.6%
[
0.0%
-
0.5%
]
0.48%
9,138,2337.0%
[
0.5%
-
1.0%
]
0.66%
4,497,6527.2%
[
0.5%
-
1.0%
]
0.89%
2,407,1376.6%
[
1.0%
-
1.5%
]
1.05%
2,204,3205.9%
[
1.0%
-
1.5%
]
1.26%
877,6175.1%
[
1.0%
-
1.5%
]
1.45%
465,9017.4%
[
1.5%
-
2.0%
]
1.63%
522,4817.6%
[
1.5%
-
2.0%
]
1.91%
496,9022.6%
[
2.0%
-
2.5%
]
2.10%
267,7674.3%
[
2.0%
-
2.5%
]
2.25%
44,0857.2%
[
2.0%
-
2.5%
]
2.49%
58,8926.7%
[
2.5%
-
3.0%
]
2.63%
50,5105.0%
[
2.5%
-
3.0%
]
2.94%
4,70014.9%
[
3.0%
-
3.5%
]
3.05%
25,1767.3%
[
3.0%
-
3.5%
]
3.22%
51,8838.4%
[
3.0%
-
3.5%
]
3.38%
66,9063.0%
[
3.5%
-
4.0%
]
3.54%
6,2389.1%
[
3.5%
-
4.0%
]
3.78%
51,4161.2%
[
4.0%
-
4.5%
]
4.17%
30,4505.1%
[
4.0%
-
4.5%
]
4.41%
12,4245.4%
[
4.5%
-
5.0%
]
4.55%
1,4291.8%
[
4.5%
-
5.0%
]
4.89%
99,8006.2%
[
5.0%
-
5.5%
]
5.04%
22,9255.6%
[
5.0%
-
5.5%
]
5.21%
8,4107.0%
[
5.0%
-
5.5%
]
5.40%
2,8152.2%
[
5.5%
-
6.0%
]
5.76%
74724.4%
[
5.5%
-
6.0%
]
5.97%
140,9942.7%
[
6.0%
-
6.5%
]
6.22%
8,8156.0%
[
6.5%
-
7.0%
]
6.58%
5,0001.1%
[
6.5%
-
7.0%
]
6.76%
1487.7%
[
6.5%
-
7.0%
]
6.99%
1434.8%
[
7.5%
-
8.0%
]
7.90%
6,9383.5%
[
8.5%
-
9.0%
]
8.81%
1,3397.2%
[
10.0%
-
10.5%
]
10.02%
5,75113.1%
[
13.0%
-
13.5%
]
13.49%
1,3946.3%
[
19.0%
-
19.5%
]
19.16%
9815.1%
[
39.0%
-
39.5%
]
39.29%
5647.8%