Trinidadian and Tobagonian 4 or more Vehicles in Household
COMPARE
Trinidadian and Tobagonian
Select to Compare
4 or more Vehicles in Household
Trinidadian and Tobagonian 4 or more Vehicles in Household
4.3%
4+ VEHICLES AVAILABLE
0.0/ 100
METRIC RATING
328th/ 347
METRIC RANK
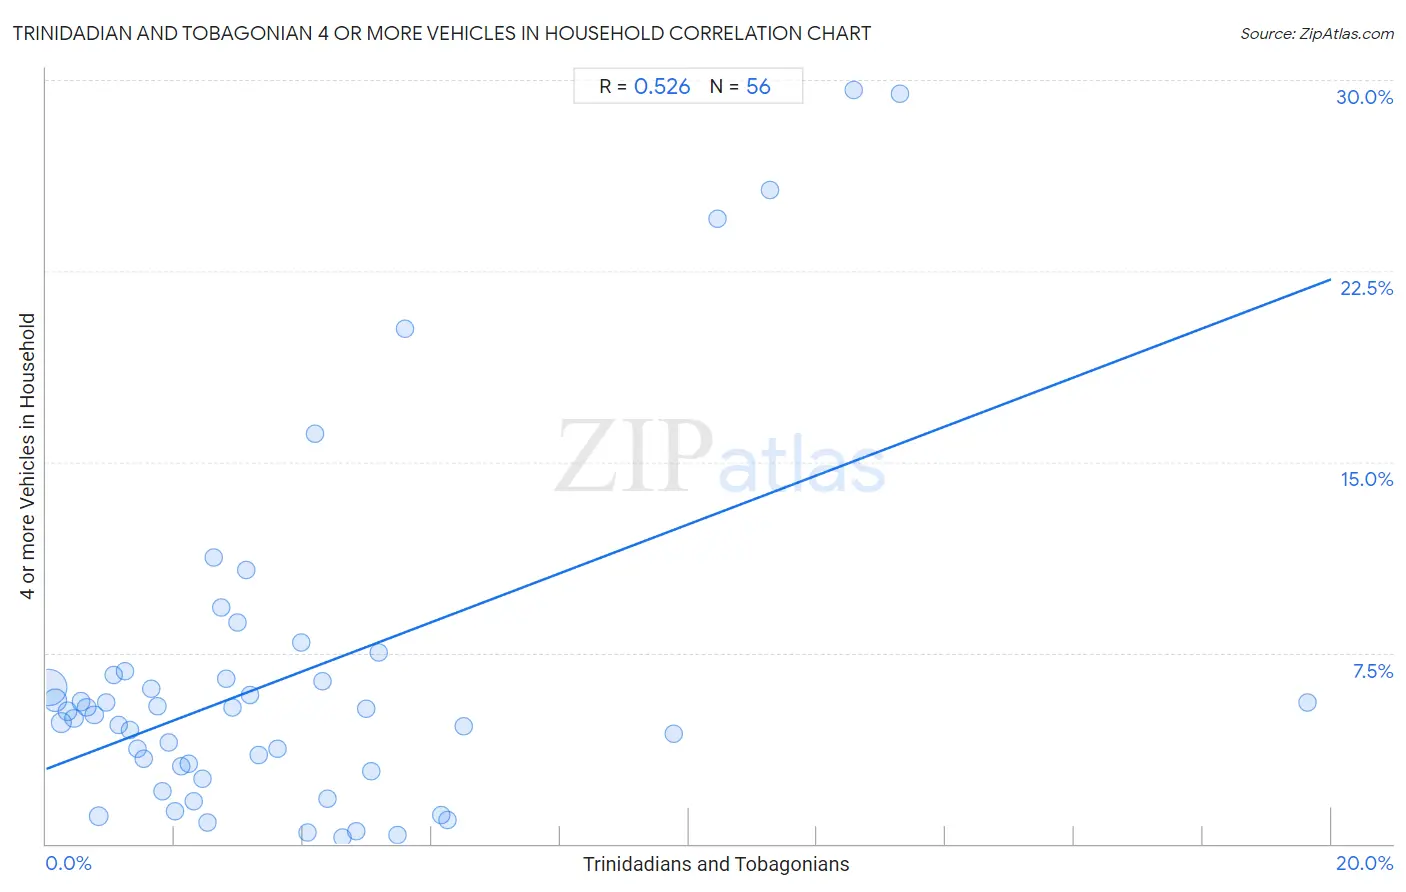
Trinidadian and Tobagonian 4 or more Vehicles in Household Correlation Chart
The statistical analysis conducted on geographies consisting of 218,579,847 people shows a substantial positive correlation between the proportion of Trinidadians and Tobagonians and percentage of households with 4 or more vehicles available in the United States with a correlation coefficient (R) of 0.526 and weighted average of 4.3%. On average, for every 1% (one percent) increase in Trinidadians and Tobagonians within a typical geography, there is an increase of 0.96% in percentage of households with 4 or more vehicles available.
It is essential to understand that the correlation between the percentage of Trinidadians and Tobagonians and percentage of households with 4 or more vehicles available does not imply a direct cause-and-effect relationship. It remains uncertain whether the presence of Trinidadians and Tobagonians influences an upward or downward trend in the level of percentage of households with 4 or more vehicles available within an area, or if Trinidadians and Tobagonians simply ended up residing in those areas with higher or lower levels of percentage of households with 4 or more vehicles available due to other factors.
Demographics Similar to Trinidadians and Tobagonians by 4 or more Vehicles in Household
In terms of 4 or more vehicles in household, the demographic groups most similar to Trinidadians and Tobagonians are Immigrants from Senegal (4.2%, a difference of 0.27%), Immigrants from Ecuador (4.2%, a difference of 0.47%), West Indian (4.2%, a difference of 0.73%), Senegalese (4.3%, a difference of 1.6%), and Immigrants from Dominica (4.2%, a difference of 1.6%).
| Demographics | Rating | Rank | 4 or more Vehicles in Household |
| Ecuadorians | 0.0 /100 | #321 | Tragic 4.5% |
| Immigrants from Yemen | 0.0 /100 | #322 | Tragic 4.5% |
| Immigrants from Caribbean | 0.0 /100 | #323 | Tragic 4.4% |
| Soviet Union | 0.0 /100 | #324 | Tragic 4.4% |
| Immigrants from Jamaica | 0.0 /100 | #325 | Tragic 4.4% |
| Cape Verdeans | 0.0 /100 | #326 | Tragic 4.4% |
| Senegalese | 0.0 /100 | #327 | Tragic 4.3% |
| Trinidadians and Tobagonians | 0.0 /100 | #328 | Tragic 4.3% |
| Immigrants from Senegal | 0.0 /100 | #329 | Tragic 4.2% |
| Immigrants from Ecuador | 0.0 /100 | #330 | Tragic 4.2% |
| West Indians | 0.0 /100 | #331 | Tragic 4.2% |
| Immigrants from Dominica | 0.0 /100 | #332 | Tragic 4.2% |
| Immigrants from Albania | 0.0 /100 | #333 | Tragic 4.1% |
| Immigrants from Trinidad and Tobago | 0.0 /100 | #334 | Tragic 4.1% |
| Barbadians | 0.0 /100 | #335 | Tragic 3.9% |
Trinidadian and Tobagonian 4 or more Vehicles in Household Correlation Summary
| Measurement | Trinidadian and Tobagonian Data | 4 or more Vehicles in Household Data |
| Minimum | 0.036% | 0.23% |
| Maximum | 19.6% | 29.6% |
| Range | 19.6% | 29.4% |
| Mean | 3.8% | 6.6% |
| Median | 2.8% | 5.1% |
| Interquartile 25% (IQ1) | 1.4% | 3.0% |
| Interquartile 75% (IQ3) | 4.9% | 6.6% |
| Interquartile Range (IQR) | 3.5% | 3.6% |
| Standard Deviation (Sample) | 3.7% | 6.8% |
| Standard Deviation (Population) | 3.7% | 6.8% |
Correlation Details
| Trinidadian and Tobagonian Percentile | Sample Size | 4 or more Vehicles in Household |
[ 0.0% - 0.5% ] 0.036% | 132,577,585 | 6.1% |
[ 0.0% - 0.5% ] 0.14% | 31,804,530 | 5.6% |
[ 0.0% - 0.5% ] 0.23% | 16,315,490 | 4.8% |
[ 0.0% - 0.5% ] 0.34% | 8,667,796 | 5.2% |
[ 0.0% - 0.5% ] 0.44% | 5,042,205 | 4.9% |
[ 0.5% - 1.0% ] 0.54% | 3,197,793 | 5.6% |
[ 0.5% - 1.0% ] 0.63% | 2,398,785 | 5.3% |
[ 0.5% - 1.0% ] 0.75% | 2,114,067 | 5.1% |
[ 0.5% - 1.0% ] 0.82% | 9,457,450 | 1.1% |
[ 0.5% - 1.0% ] 0.93% | 858,875 | 5.6% |
[ 1.0% - 1.5% ] 1.05% | 699,807 | 6.6% |
[ 1.0% - 1.5% ] 1.13% | 829,433 | 4.7% |
[ 1.0% - 1.5% ] 1.23% | 839,697 | 6.8% |
[ 1.0% - 1.5% ] 1.31% | 505,216 | 4.5% |
[ 1.0% - 1.5% ] 1.43% | 531,637 | 3.7% |
[ 1.5% - 2.0% ] 1.51% | 229,441 | 3.4% |
[ 1.5% - 2.0% ] 1.63% | 210,325 | 6.1% |
[ 1.5% - 2.0% ] 1.73% | 197,456 | 5.4% |
[ 1.5% - 2.0% ] 1.82% | 221,400 | 2.1% |
[ 1.5% - 2.0% ] 1.91% | 176,402 | 4.0% |
[ 2.0% - 2.5% ] 2.01% | 113,270 | 1.3% |
[ 2.0% - 2.5% ] 2.09% | 78,239 | 3.1% |
[ 2.0% - 2.5% ] 2.21% | 48,654 | 3.1% |
[ 2.0% - 2.5% ] 2.30% | 211,962 | 1.7% |
[ 2.0% - 2.5% ] 2.43% | 119,105 | 2.6% |
[ 2.5% - 3.0% ] 2.52% | 105,641 | 0.84% |
[ 2.5% - 3.0% ] 2.61% | 16,459 | 11.2% |
[ 2.5% - 3.0% ] 2.73% | 41,797 | 9.3% |
[ 2.5% - 3.0% ] 2.81% | 26,547 | 6.5% |
[ 2.5% - 3.0% ] 2.90% | 63,522 | 5.4% |
[ 2.5% - 3.0% ] 2.97% | 1,649 | 8.7% |
[ 3.0% - 3.5% ] 3.12% | 1,058 | 10.8% |
[ 3.0% - 3.5% ] 3.17% | 28,606 | 5.8% |
[ 3.0% - 3.5% ] 3.31% | 74,741 | 3.5% |
[ 3.5% - 4.0% ] 3.61% | 8,260 | 3.7% |
[ 3.5% - 4.0% ] 3.97% | 57,192 | 7.9% |
[ 4.0% - 4.5% ] 4.07% | 87,698 | 0.45% |
[ 4.0% - 4.5% ] 4.17% | 10,495 | 16.1% |
[ 4.0% - 4.5% ] 4.30% | 7,953 | 6.4% |
[ 4.0% - 4.5% ] 4.38% | 150,387 | 1.8% |
[ 4.5% - 5.0% ] 4.62% | 101,053 | 0.23% |
[ 4.5% - 5.0% ] 4.83% | 100,082 | 0.49% |
[ 4.5% - 5.0% ] 4.98% | 51,153 | 5.3% |
[ 5.0% - 5.5% ] 5.05% | 66,262 | 2.8% |
[ 5.0% - 5.5% ] 5.17% | 6,851 | 7.5% |
[ 5.0% - 5.5% ] 5.47% | 78,506 | 0.34% |
[ 5.5% - 6.0% ] 5.57% | 2,332 | 20.2% |
[ 6.0% - 6.5% ] 6.14% | 29,820 | 1.1% |
[ 6.0% - 6.5% ] 6.24% | 2,322 | 0.93% |
[ 6.0% - 6.5% ] 6.49% | 1,510 | 4.6% |
[ 9.5% - 10.0% ] 9.77% | 1,177 | 4.3% |
[ 10.0% - 10.5% ] 10.45% | 134 | 24.6% |
[ 11.0% - 11.5% ] 11.27% | 630 | 25.7% |
[ 12.5% - 13.0% ] 12.56% | 4,179 | 29.6% |
[ 13.0% - 13.5% ] 13.29% | 2,980 | 29.5% |
[ 19.5% - 20.0% ] 19.63% | 2,231 | 5.6% |