Comanche 4 or more Vehicles in Household
COMPARE
Comanche
Select to Compare
4 or more Vehicles in Household
Comanche 4 or more Vehicles in Household
6.8%
4+ VEHICLES AVAILABLE
94.8/ 100
METRIC RATING
120th/ 347
METRIC RANK
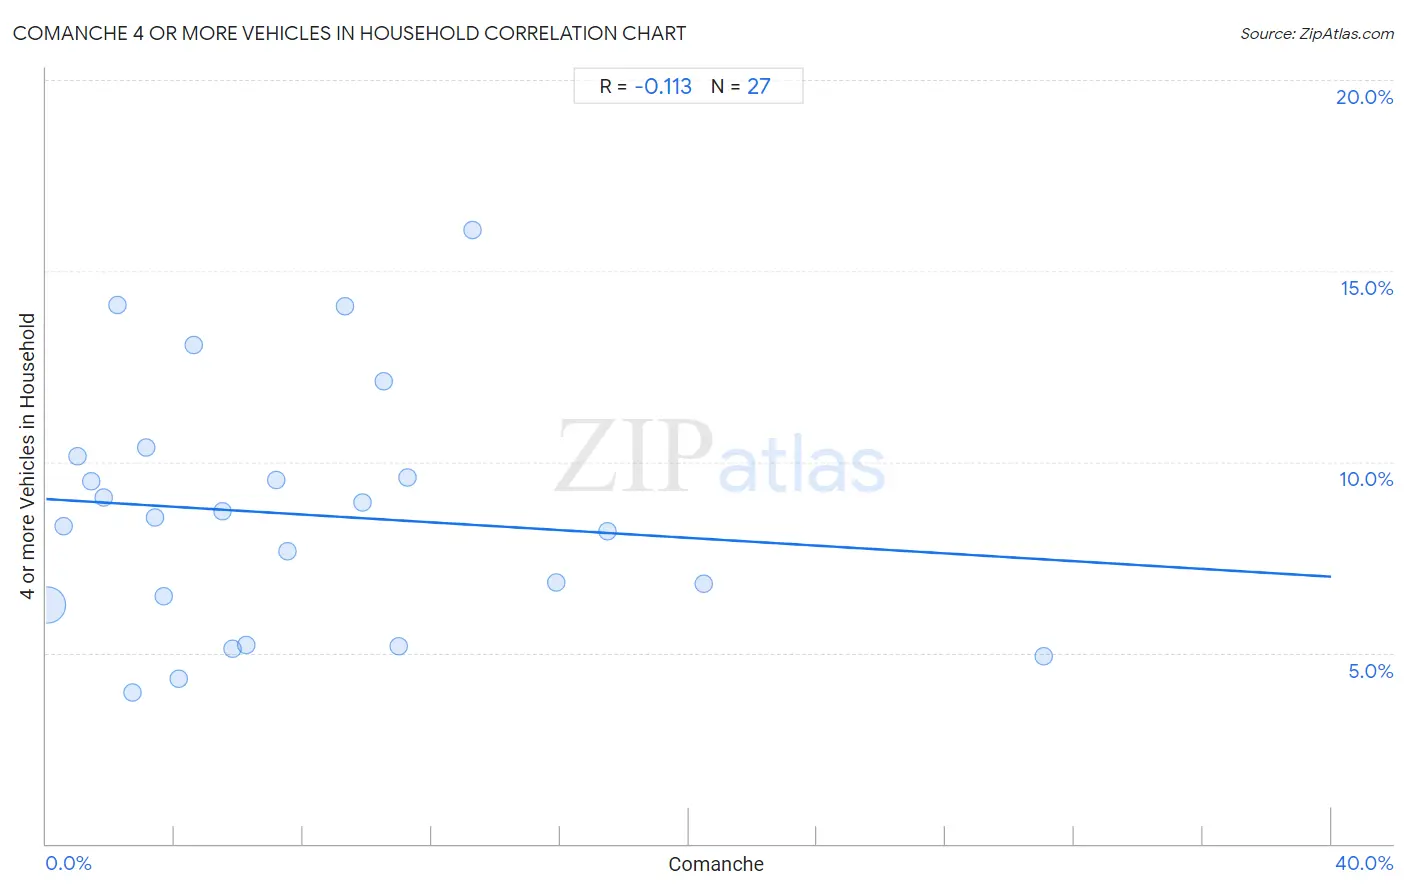
Comanche 4 or more Vehicles in Household Correlation Chart
The statistical analysis conducted on geographies consisting of 109,674,295 people shows a poor negative correlation between the proportion of Comanche and percentage of households with 4 or more vehicles available in the United States with a correlation coefficient (R) of -0.113 and weighted average of 6.8%. On average, for every 1% (one percent) increase in Comanche within a typical geography, there is a decrease of 0.051% in percentage of households with 4 or more vehicles available.
It is essential to understand that the correlation between the percentage of Comanche and percentage of households with 4 or more vehicles available does not imply a direct cause-and-effect relationship. It remains uncertain whether the presence of Comanche influences an upward or downward trend in the level of percentage of households with 4 or more vehicles available within an area, or if Comanche simply ended up residing in those areas with higher or lower levels of percentage of households with 4 or more vehicles available due to other factors.
Demographics Similar to Comanche by 4 or more Vehicles in Household
In terms of 4 or more vehicles in household, the demographic groups most similar to Comanche are Immigrants from Germany (6.8%, a difference of 0.060%), Immigrants from Nicaragua (6.8%, a difference of 0.060%), Immigrants (6.8%, a difference of 0.13%), Immigrants from Asia (6.8%, a difference of 0.23%), and Austrian (6.8%, a difference of 0.32%).
| Demographics | Rating | Rank | 4 or more Vehicles in Household |
| Canadians | 96.4 /100 | #113 | Exceptional 6.9% |
| Bolivians | 96.3 /100 | #114 | Exceptional 6.8% |
| Tlingit-Haida | 96.2 /100 | #115 | Exceptional 6.8% |
| Immigrants from Guatemala | 95.8 /100 | #116 | Exceptional 6.8% |
| Burmese | 95.7 /100 | #117 | Exceptional 6.8% |
| French American Indians | 95.7 /100 | #118 | Exceptional 6.8% |
| Costa Ricans | 95.5 /100 | #119 | Exceptional 6.8% |
| Comanche | 94.8 /100 | #120 | Exceptional 6.8% |
| Immigrants from Germany | 94.7 /100 | #121 | Exceptional 6.8% |
| Immigrants from Nicaragua | 94.7 /100 | #122 | Exceptional 6.8% |
| Immigrants | 94.6 /100 | #123 | Exceptional 6.8% |
| Immigrants from Asia | 94.4 /100 | #124 | Exceptional 6.8% |
| Austrians | 94.1 /100 | #125 | Exceptional 6.8% |
| Belgians | 94.1 /100 | #126 | Exceptional 6.8% |
| Immigrants from Korea | 93.8 /100 | #127 | Exceptional 6.8% |
Comanche 4 or more Vehicles in Household Correlation Summary
| Measurement | Comanche Data | 4 or more Vehicles in Household Data |
| Minimum | 0.034% | 4.0% |
| Maximum | 31.0% | 16.1% |
| Range | 31.0% | 12.1% |
| Mean | 7.8% | 8.6% |
| Median | 5.8% | 8.5% |
| Interquartile 25% (IQ1) | 2.7% | 6.2% |
| Interquartile 75% (IQ3) | 11.0% | 10.1% |
| Interquartile Range (IQR) | 8.3% | 3.9% |
| Standard Deviation (Sample) | 7.1% | 3.2% |
| Standard Deviation (Population) | 7.0% | 3.1% |
Correlation Details
| Comanche Percentile | Sample Size | 4 or more Vehicles in Household |
[ 0.0% - 0.5% ] 0.034% | 107,995,576 | 6.2% |
[ 0.5% - 1.0% ] 0.53% | 1,131,760 | 8.3% |
[ 0.5% - 1.0% ] 0.98% | 165,219 | 10.1% |
[ 1.0% - 1.5% ] 1.40% | 64,377 | 9.5% |
[ 1.5% - 2.0% ] 1.80% | 37,119 | 9.1% |
[ 2.0% - 2.5% ] 2.21% | 14,047 | 14.1% |
[ 2.5% - 3.0% ] 2.70% | 154,973 | 4.0% |
[ 3.0% - 3.5% ] 3.12% | 35,040 | 10.4% |
[ 3.0% - 3.5% ] 3.39% | 6,823 | 8.5% |
[ 3.5% - 4.0% ] 3.64% | 23,169 | 6.5% |
[ 4.0% - 4.5% ] 4.11% | 1,654 | 4.3% |
[ 4.5% - 5.0% ] 4.61% | 4,145 | 13.1% |
[ 5.5% - 6.0% ] 5.50% | 10,507 | 8.7% |
[ 5.5% - 6.0% ] 5.78% | 2,994 | 5.1% |
[ 6.0% - 6.5% ] 6.23% | 6,086 | 5.2% |
[ 7.0% - 7.5% ] 7.14% | 1,148 | 9.5% |
[ 7.0% - 7.5% ] 7.49% | 3,230 | 7.7% |
[ 9.0% - 9.5% ] 9.29% | 312 | 14.1% |
[ 9.5% - 10.0% ] 9.83% | 2,563 | 8.9% |
[ 10.5% - 11.0% ] 10.52% | 4,867 | 12.1% |
[ 10.5% - 11.0% ] 10.99% | 1,438 | 5.2% |
[ 11.0% - 11.5% ] 11.26% | 1,377 | 9.6% |
[ 13.0% - 13.5% ] 13.27% | 1,341 | 16.1% |
[ 15.5% - 16.0% ] 15.87% | 2,974 | 6.8% |
[ 17.0% - 17.5% ] 17.46% | 1,065 | 8.2% |
[ 20.0% - 20.5% ] 20.49% | 288 | 6.8% |
[ 31.0% - 31.5% ] 31.03% | 203 | 4.9% |