South African 4 or more Vehicles in Household
COMPARE
South African
Select to Compare
4 or more Vehicles in Household
South African 4 or more Vehicles in Household
6.2%
4+ VEHICLES AVAILABLE
32.2/ 100
METRIC RATING
190th/ 347
METRIC RANK
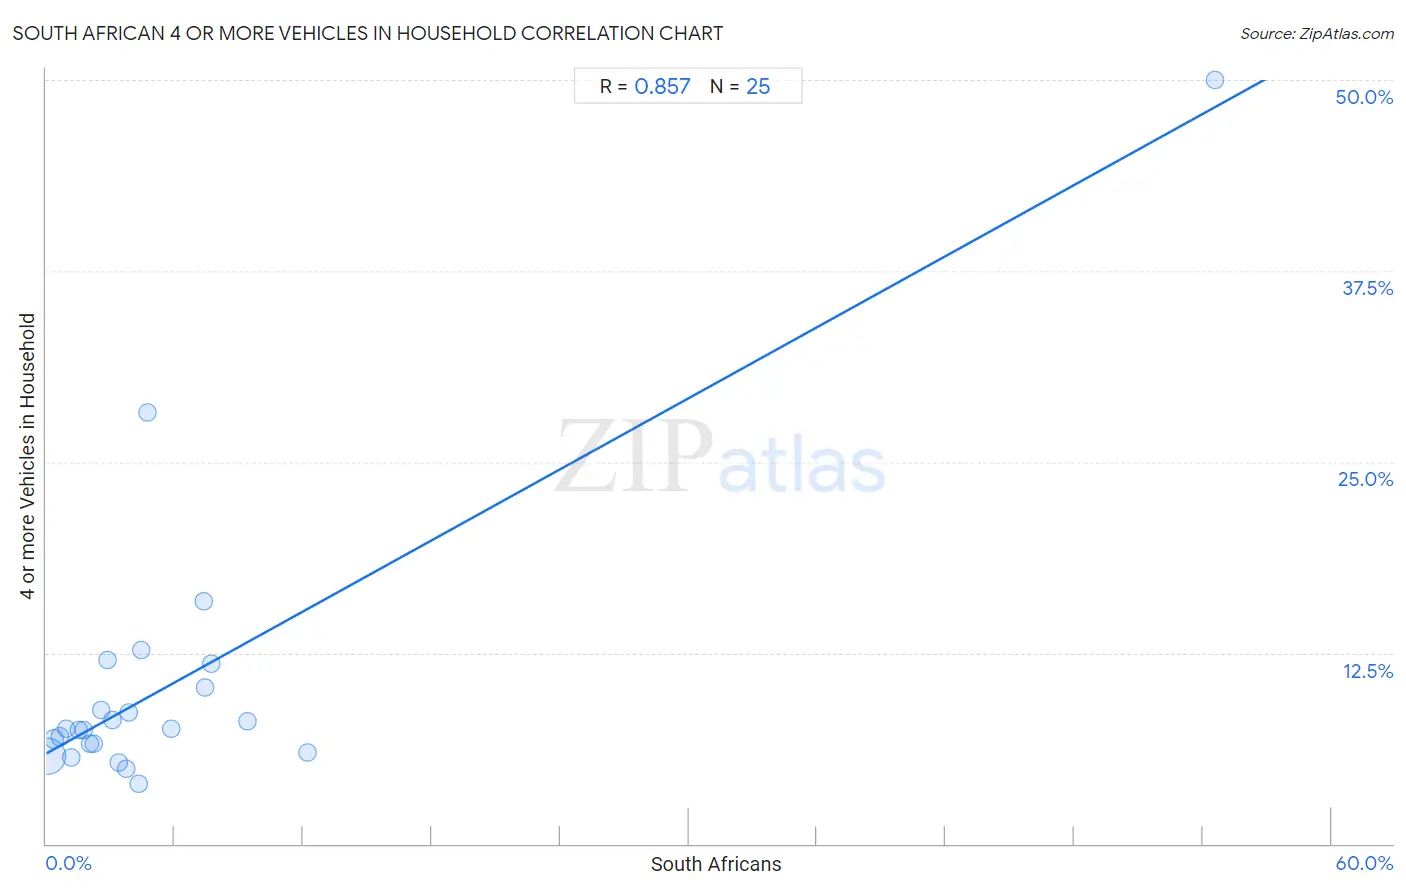
South African 4 or more Vehicles in Household Correlation Chart
The statistical analysis conducted on geographies consisting of 181,747,676 people shows a very strong positive correlation between the proportion of South Africans and percentage of households with 4 or more vehicles available in the United States with a correlation coefficient (R) of 0.857 and weighted average of 6.2%. On average, for every 1% (one percent) increase in South Africans within a typical geography, there is an increase of 0.78% in percentage of households with 4 or more vehicles available.
It is essential to understand that the correlation between the percentage of South Africans and percentage of households with 4 or more vehicles available does not imply a direct cause-and-effect relationship. It remains uncertain whether the presence of South Africans influences an upward or downward trend in the level of percentage of households with 4 or more vehicles available within an area, or if South Africans simply ended up residing in those areas with higher or lower levels of percentage of households with 4 or more vehicles available due to other factors.
Demographics Similar to South Africans by 4 or more Vehicles in Household
In terms of 4 or more vehicles in household, the demographic groups most similar to South Africans are Immigrants from Eastern Asia (6.2%, a difference of 0.12%), Inupiat (6.2%, a difference of 0.18%), Romanian (6.2%, a difference of 0.19%), Kiowa (6.2%, a difference of 0.29%), and Immigrants from South Africa (6.2%, a difference of 0.36%).
| Demographics | Rating | Rank | 4 or more Vehicles in Household |
| Immigrants from Burma/Myanmar | 37.5 /100 | #183 | Fair 6.2% |
| Iraqis | 37.3 /100 | #184 | Fair 6.2% |
| Thais | 36.9 /100 | #185 | Fair 6.2% |
| Immigrants from Northern Europe | 36.8 /100 | #186 | Fair 6.2% |
| Immigrants from South Africa | 35.4 /100 | #187 | Fair 6.2% |
| Kiowa | 34.7 /100 | #188 | Fair 6.2% |
| Immigrants from Eastern Asia | 33.3 /100 | #189 | Fair 6.2% |
| South Africans | 32.2 /100 | #190 | Fair 6.2% |
| Inupiat | 30.7 /100 | #191 | Fair 6.2% |
| Romanians | 30.7 /100 | #192 | Fair 6.2% |
| Immigrants from Kuwait | 28.0 /100 | #193 | Fair 6.2% |
| Immigrants from Sweden | 27.0 /100 | #194 | Fair 6.2% |
| Argentineans | 27.0 /100 | #195 | Fair 6.2% |
| Tsimshian | 26.4 /100 | #196 | Fair 6.2% |
| Immigrants from Sri Lanka | 23.7 /100 | #197 | Fair 6.1% |
South African 4 or more Vehicles in Household Correlation Summary
| Measurement | South African Data | 4 or more Vehicles in Household Data |
| Minimum | 0.053% | 3.9% |
| Maximum | 54.5% | 50.0% |
| Range | 54.5% | 46.1% |
| Mean | 5.9% | 10.5% |
| Median | 3.4% | 7.5% |
| Interquartile 25% (IQ1) | 1.6% | 6.2% |
| Interquartile 75% (IQ3) | 6.6% | 11.0% |
| Interquartile Range (IQR) | 4.9% | 4.8% |
| Standard Deviation (Sample) | 10.6% | 9.6% |
| Standard Deviation (Population) | 10.4% | 9.4% |
Correlation Details
| South African Percentile | Sample Size | 4 or more Vehicles in Household |
[ 0.0% - 0.5% ] 0.053% | 173,254,161 | 5.7% |
[ 0.0% - 0.5% ] 0.37% | 5,866,782 | 6.9% |
[ 0.5% - 1.0% ] 0.66% | 1,481,627 | 7.0% |
[ 0.5% - 1.0% ] 0.95% | 526,952 | 7.5% |
[ 1.0% - 1.5% ] 1.18% | 172,782 | 5.6% |
[ 1.0% - 1.5% ] 1.50% | 148,725 | 7.5% |
[ 1.5% - 2.0% ] 1.77% | 69,808 | 7.5% |
[ 2.0% - 2.5% ] 2.04% | 57,829 | 6.5% |
[ 2.0% - 2.5% ] 2.20% | 21,693 | 6.5% |
[ 2.5% - 3.0% ] 2.59% | 32,668 | 8.7% |
[ 2.5% - 3.0% ] 2.86% | 21,577 | 12.0% |
[ 3.0% - 3.5% ] 3.08% | 38,114 | 8.1% |
[ 3.0% - 3.5% ] 3.37% | 4,717 | 5.3% |
[ 3.5% - 4.0% ] 3.73% | 9,890 | 4.9% |
[ 3.5% - 4.0% ] 3.84% | 26,498 | 8.6% |
[ 4.0% - 4.5% ] 4.34% | 4,450 | 3.9% |
[ 4.0% - 4.5% ] 4.46% | 3,541 | 12.7% |
[ 4.5% - 5.0% ] 4.74% | 190 | 28.2% |
[ 5.5% - 6.0% ] 5.84% | 377 | 7.5% |
[ 7.0% - 7.5% ] 7.33% | 1,638 | 15.8% |
[ 7.0% - 7.5% ] 7.39% | 1,841 | 10.2% |
[ 7.5% - 8.0% ] 7.69% | 65 | 11.8% |
[ 9.0% - 9.5% ] 9.40% | 755 | 8.0% |
[ 12.0% - 12.5% ] 12.18% | 985 | 5.9% |
[ 54.5% - 55.0% ] 54.55% | 11 | 50.0% |