German Russian 4 or more Vehicles in Household
COMPARE
German Russian
Select to Compare
4 or more Vehicles in Household
German Russian 4 or more Vehicles in Household
7.0%
4+ VEHICLES AVAILABLE
98.3/ 100
METRIC RATING
105th/ 347
METRIC RANK
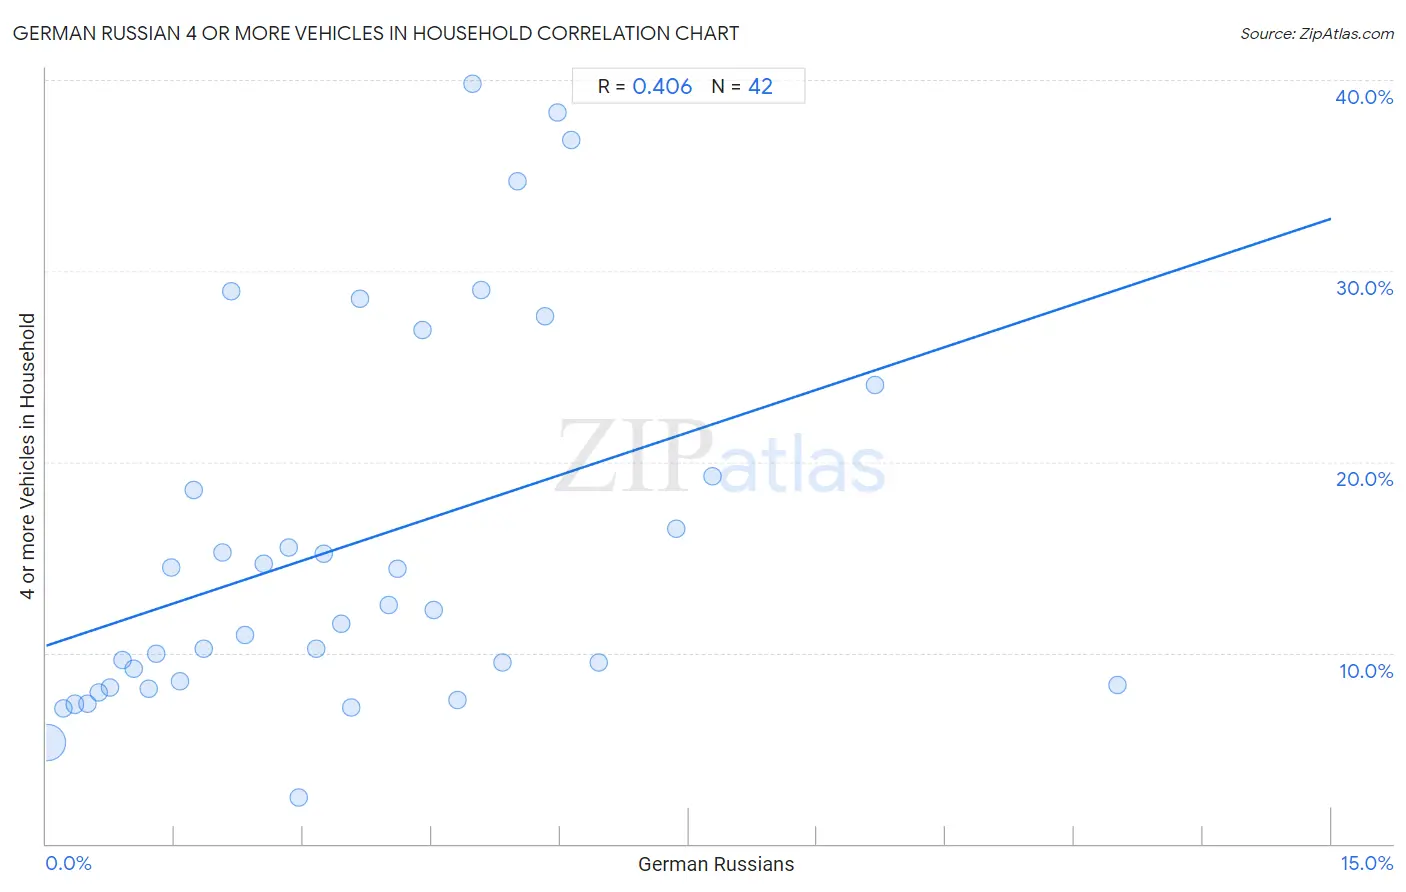
German Russian 4 or more Vehicles in Household Correlation Chart
The statistical analysis conducted on geographies consisting of 96,366,616 people shows a moderate positive correlation between the proportion of German Russians and percentage of households with 4 or more vehicles available in the United States with a correlation coefficient (R) of 0.406 and weighted average of 7.0%. On average, for every 1% (one percent) increase in German Russians within a typical geography, there is an increase of 1.5% in percentage of households with 4 or more vehicles available.
It is essential to understand that the correlation between the percentage of German Russians and percentage of households with 4 or more vehicles available does not imply a direct cause-and-effect relationship. It remains uncertain whether the presence of German Russians influences an upward or downward trend in the level of percentage of households with 4 or more vehicles available within an area, or if German Russians simply ended up residing in those areas with higher or lower levels of percentage of households with 4 or more vehicles available due to other factors.
Demographics Similar to German Russians by 4 or more Vehicles in Household
In terms of 4 or more vehicles in household, the demographic groups most similar to German Russians are Hmong (7.0%, a difference of 0.0%), Guatemalan (7.0%, a difference of 0.34%), Nicaraguan (7.0%, a difference of 0.36%), Blackfeet (7.0%, a difference of 0.48%), and Asian (7.0%, a difference of 0.49%).
| Demographics | Rating | Rank | 4 or more Vehicles in Household |
| Irish | 99.0 /100 | #98 | Exceptional 7.1% |
| Seminole | 98.8 /100 | #99 | Exceptional 7.0% |
| Taiwanese | 98.7 /100 | #100 | Exceptional 7.0% |
| Pakistanis | 98.7 /100 | #101 | Exceptional 7.0% |
| Asians | 98.6 /100 | #102 | Exceptional 7.0% |
| Blackfeet | 98.6 /100 | #103 | Exceptional 7.0% |
| Hmong | 98.3 /100 | #104 | Exceptional 7.0% |
| German Russians | 98.3 /100 | #105 | Exceptional 7.0% |
| Guatemalans | 98.1 /100 | #106 | Exceptional 7.0% |
| Nicaraguans | 98.0 /100 | #107 | Exceptional 7.0% |
| French | 97.7 /100 | #108 | Exceptional 6.9% |
| Filipinos | 97.6 /100 | #109 | Exceptional 6.9% |
| Immigrants from Thailand | 97.0 /100 | #110 | Exceptional 6.9% |
| Aleuts | 97.0 /100 | #111 | Exceptional 6.9% |
| Hopi | 97.0 /100 | #112 | Exceptional 6.9% |
German Russian 4 or more Vehicles in Household Correlation Summary
| Measurement | German Russian Data | 4 or more Vehicles in Household Data |
| Minimum | 0.022% | 2.4% |
| Maximum | 12.5% | 39.8% |
| Range | 12.5% | 37.3% |
| Mean | 3.6% | 15.7% |
| Median | 3.2% | 11.9% |
| Interquartile 25% (IQ1) | 1.5% | 8.3% |
| Interquartile 75% (IQ3) | 5.1% | 19.2% |
| Interquartile Range (IQR) | 3.6% | 10.9% |
| Standard Deviation (Sample) | 2.7% | 9.9% |
| Standard Deviation (Population) | 2.7% | 9.8% |
Correlation Details
| German Russian Percentile | Sample Size | 4 or more Vehicles in Household |
[ 0.0% - 0.5% ] 0.022% | 90,573,014 | 5.3% |
[ 0.0% - 0.5% ] 0.20% | 3,216,227 | 7.1% |
[ 0.0% - 0.5% ] 0.34% | 1,032,449 | 7.3% |
[ 0.0% - 0.5% ] 0.48% | 533,668 | 7.3% |
[ 0.5% - 1.0% ] 0.62% | 283,179 | 7.9% |
[ 0.5% - 1.0% ] 0.74% | 212,642 | 8.2% |
[ 0.5% - 1.0% ] 0.90% | 56,642 | 9.7% |
[ 1.0% - 1.5% ] 1.03% | 153,081 | 9.2% |
[ 1.0% - 1.5% ] 1.20% | 96,510 | 8.1% |
[ 1.0% - 1.5% ] 1.29% | 73,958 | 9.9% |
[ 1.0% - 1.5% ] 1.46% | 5,268 | 14.5% |
[ 1.5% - 2.0% ] 1.56% | 42,866 | 8.5% |
[ 1.5% - 2.0% ] 1.73% | 1,737 | 18.5% |
[ 1.5% - 2.0% ] 1.85% | 32,998 | 10.2% |
[ 2.0% - 2.5% ] 2.05% | 5,557 | 15.2% |
[ 2.0% - 2.5% ] 2.16% | 9,209 | 29.0% |
[ 2.0% - 2.5% ] 2.32% | 7,938 | 10.9% |
[ 2.5% - 3.0% ] 2.54% | 2,397 | 14.6% |
[ 2.5% - 3.0% ] 2.84% | 2,679 | 15.5% |
[ 2.5% - 3.0% ] 2.95% | 611 | 2.4% |
[ 3.0% - 3.5% ] 3.15% | 349 | 10.2% |
[ 3.0% - 3.5% ] 3.23% | 2,288 | 15.2% |
[ 3.0% - 3.5% ] 3.44% | 1,280 | 11.5% |
[ 3.5% - 4.0% ] 3.56% | 12,593 | 7.1% |
[ 3.5% - 4.0% ] 3.67% | 109 | 28.5% |
[ 4.0% - 4.5% ] 4.00% | 25 | 12.5% |
[ 4.0% - 4.5% ] 4.10% | 2,292 | 14.4% |
[ 4.0% - 4.5% ] 4.40% | 455 | 26.9% |
[ 4.5% - 5.0% ] 4.52% | 951 | 12.3% |
[ 4.5% - 5.0% ] 4.80% | 125 | 7.5% |
[ 4.5% - 5.0% ] 4.97% | 523 | 39.8% |
[ 5.0% - 5.5% ] 5.07% | 138 | 29.0% |
[ 5.0% - 5.5% ] 5.32% | 808 | 9.5% |
[ 5.5% - 6.0% ] 5.50% | 218 | 34.7% |
[ 5.5% - 6.0% ] 5.82% | 464 | 27.6% |
[ 5.5% - 6.0% ] 5.97% | 703 | 38.3% |
[ 6.0% - 6.5% ] 6.12% | 49 | 36.8% |
[ 6.0% - 6.5% ] 6.45% | 31 | 9.5% |
[ 7.0% - 7.5% ] 7.36% | 231 | 16.5% |
[ 7.5% - 8.0% ] 7.78% | 90 | 19.2% |
[ 9.5% - 10.0% ] 9.68% | 248 | 24.0% |
[ 12.0% - 12.5% ] 12.50% | 16 | 8.3% |