Immigrants from Central America 4 or more Vehicles in Household
COMPARE
Immigrants from Central America
Select to Compare
4 or more Vehicles in Household
Immigrants from Central America 4 or more Vehicles in Household
8.5%
4+ VEHICLES AVAILABLE
100.0/ 100
METRIC RATING
24th/ 347
METRIC RANK
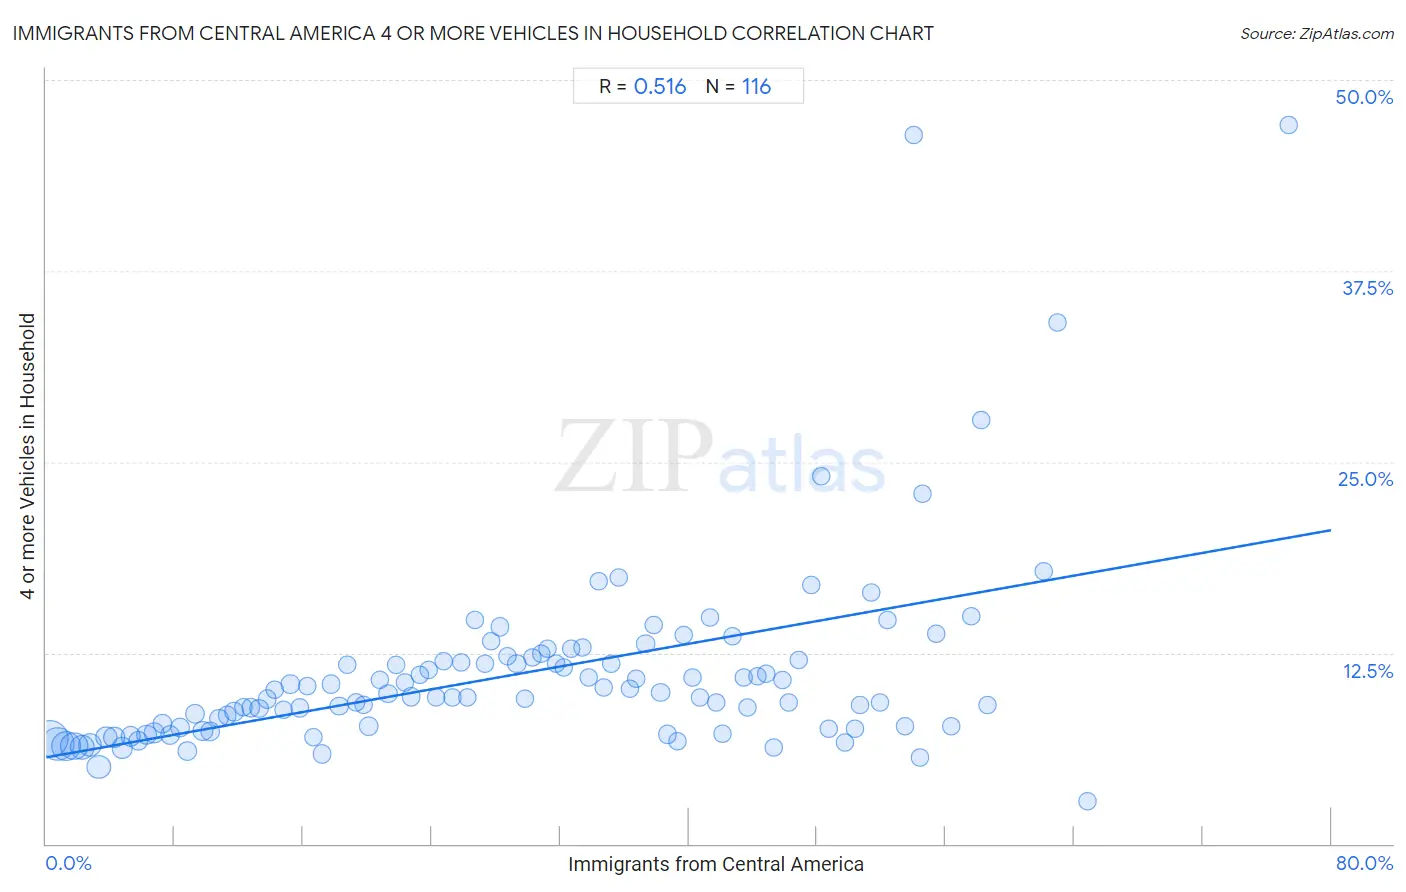
Immigrants from Central America 4 or more Vehicles in Household Correlation Chart
The statistical analysis conducted on geographies consisting of 533,607,321 people shows a substantial positive correlation between the proportion of Immigrants from Central America and percentage of households with 4 or more vehicles available in the United States with a correlation coefficient (R) of 0.516 and weighted average of 8.5%. On average, for every 1% (one percent) increase in Immigrants from Central America within a typical geography, there is an increase of 0.19% in percentage of households with 4 or more vehicles available.
It is essential to understand that the correlation between the percentage of Immigrants from Central America and percentage of households with 4 or more vehicles available does not imply a direct cause-and-effect relationship. It remains uncertain whether the presence of Immigrants from Central America influences an upward or downward trend in the level of percentage of households with 4 or more vehicles available within an area, or if Immigrants from Central America simply ended up residing in those areas with higher or lower levels of percentage of households with 4 or more vehicles available due to other factors.
Demographics Similar to Immigrants from Central America by 4 or more Vehicles in Household
In terms of 4 or more vehicles in household, the demographic groups most similar to Immigrants from Central America are Basque (8.4%, a difference of 0.54%), Immigrants from Philippines (8.5%, a difference of 0.82%), Mexican American Indian (8.4%, a difference of 0.86%), Sri Lankan (8.4%, a difference of 0.98%), and Immigrants from Vietnam (8.6%, a difference of 1.0%).
| Demographics | Rating | Rank | 4 or more Vehicles in Household |
| Ute | 100.0 /100 | #17 | Exceptional 8.8% |
| Nepalese | 100.0 /100 | #18 | Exceptional 8.7% |
| Koreans | 100.0 /100 | #19 | Exceptional 8.6% |
| Pueblo | 100.0 /100 | #20 | Exceptional 8.6% |
| Danes | 100.0 /100 | #21 | Exceptional 8.6% |
| Immigrants from Vietnam | 100.0 /100 | #22 | Exceptional 8.6% |
| Immigrants from Philippines | 100.0 /100 | #23 | Exceptional 8.5% |
| Immigrants from Central America | 100.0 /100 | #24 | Exceptional 8.5% |
| Basques | 100.0 /100 | #25 | Exceptional 8.4% |
| Mexican American Indians | 100.0 /100 | #26 | Exceptional 8.4% |
| Sri Lankans | 100.0 /100 | #27 | Exceptional 8.4% |
| Cheyenne | 100.0 /100 | #28 | Exceptional 8.3% |
| Immigrants from South Eastern Asia | 100.0 /100 | #29 | Exceptional 8.2% |
| Navajo | 100.0 /100 | #30 | Exceptional 8.2% |
| Natives/Alaskans | 100.0 /100 | #31 | Exceptional 8.2% |
Immigrants from Central America 4 or more Vehicles in Household Correlation Summary
| Measurement | Immigrants from Central America Data | 4 or more Vehicles in Household Data |
| Minimum | 0.25% | 2.8% |
| Maximum | 77.4% | 47.1% |
| Range | 77.1% | 44.3% |
| Mean | 29.6% | 11.2% |
| Median | 29.0% | 9.6% |
| Interquartile 25% (IQ1) | 14.5% | 7.6% |
| Interquartile 75% (IQ3) | 43.6% | 12.0% |
| Interquartile Range (IQR) | 29.1% | 4.4% |
| Standard Deviation (Sample) | 17.8% | 6.4% |
| Standard Deviation (Population) | 17.8% | 6.4% |
Correlation Details
| Immigrants from Central America Percentile | Sample Size | 4 or more Vehicles in Household |
[ 0.0% - 0.5% ] 0.25% | 86,814,321 | 6.9% |
[ 0.5% - 1.0% ] 0.73% | 67,237,767 | 6.6% |
[ 1.0% - 1.5% ] 1.24% | 53,452,875 | 6.4% |
[ 1.5% - 2.0% ] 1.75% | 41,875,514 | 6.4% |
[ 2.0% - 2.5% ] 2.24% | 30,840,495 | 6.3% |
[ 2.5% - 3.0% ] 2.74% | 23,698,165 | 6.4% |
[ 3.0% - 3.5% ] 3.25% | 28,303,820 | 5.0% |
[ 3.5% - 4.0% ] 3.73% | 15,978,115 | 7.0% |
[ 4.0% - 4.5% ] 4.24% | 13,096,242 | 6.9% |
[ 4.5% - 5.0% ] 4.72% | 13,883,717 | 6.3% |
[ 5.0% - 5.5% ] 5.26% | 10,847,201 | 7.0% |
[ 5.5% - 6.0% ] 5.74% | 10,098,515 | 6.7% |
[ 6.0% - 6.5% ] 6.25% | 8,218,413 | 7.2% |
[ 6.5% - 7.0% ] 6.72% | 8,219,156 | 7.3% |
[ 7.0% - 7.5% ] 7.26% | 6,694,134 | 7.9% |
[ 7.5% - 8.0% ] 7.71% | 5,553,617 | 7.1% |
[ 8.0% - 8.5% ] 8.29% | 5,786,486 | 7.6% |
[ 8.5% - 9.0% ] 8.77% | 7,337,878 | 6.1% |
[ 9.0% - 9.5% ] 9.27% | 5,767,416 | 8.5% |
[ 9.5% - 10.0% ] 9.74% | 8,147,549 | 7.4% |
[ 10.0% - 10.5% ] 10.22% | 4,442,488 | 7.3% |
[ 10.5% - 11.0% ] 10.74% | 3,916,382 | 8.2% |
[ 11.0% - 11.5% ] 11.26% | 2,717,595 | 8.4% |
[ 11.5% - 12.0% ] 11.70% | 1,878,167 | 8.6% |
[ 12.0% - 12.5% ] 12.27% | 2,896,054 | 8.9% |
[ 12.5% - 13.0% ] 12.73% | 4,406,057 | 8.9% |
[ 13.0% - 13.5% ] 13.26% | 2,624,963 | 8.9% |
[ 13.5% - 14.0% ] 13.74% | 2,861,445 | 9.5% |
[ 14.0% - 14.5% ] 14.24% | 2,863,404 | 10.1% |
[ 14.5% - 15.0% ] 14.76% | 1,874,588 | 8.8% |
[ 15.0% - 15.5% ] 15.19% | 2,266,741 | 10.4% |
[ 15.5% - 16.0% ] 15.76% | 1,864,781 | 8.9% |
[ 16.0% - 16.5% ] 16.26% | 1,571,570 | 10.3% |
[ 16.5% - 17.0% ] 16.65% | 3,019,343 | 7.0% |
[ 17.0% - 17.5% ] 17.18% | 3,709,213 | 5.9% |
[ 17.5% - 18.0% ] 17.74% | 2,008,409 | 10.4% |
[ 18.0% - 18.5% ] 18.25% | 1,687,617 | 9.0% |
[ 18.5% - 19.0% ] 18.74% | 2,506,956 | 11.7% |
[ 19.0% - 19.5% ] 19.26% | 1,398,579 | 9.2% |
[ 19.5% - 20.0% ] 19.74% | 1,369,324 | 9.1% |
[ 20.0% - 20.5% ] 20.09% | 6,094,550 | 7.7% |
[ 20.5% - 21.0% ] 20.77% | 1,403,354 | 10.7% |
[ 21.0% - 21.5% ] 21.28% | 994,085 | 9.8% |
[ 21.5% - 22.0% ] 21.78% | 1,206,414 | 11.7% |
[ 22.0% - 22.5% ] 22.30% | 903,134 | 10.5% |
[ 22.5% - 23.0% ] 22.73% | 921,202 | 9.6% |
[ 23.0% - 23.5% ] 23.28% | 1,499,347 | 11.1% |
[ 23.5% - 24.0% ] 23.79% | 1,081,993 | 11.4% |
[ 24.0% - 24.5% ] 24.29% | 1,134,028 | 9.6% |
[ 24.5% - 25.0% ] 24.75% | 859,539 | 12.0% |
[ 25.0% - 25.5% ] 25.30% | 712,873 | 9.5% |
[ 25.5% - 26.0% ] 25.84% | 597,504 | 11.9% |
[ 26.0% - 26.5% ] 26.23% | 1,073,635 | 9.6% |
[ 26.5% - 27.0% ] 26.72% | 491,071 | 14.6% |
[ 27.0% - 27.5% ] 27.32% | 534,287 | 11.8% |
[ 27.5% - 28.0% ] 27.68% | 1,053,088 | 13.3% |
[ 28.0% - 28.5% ] 28.23% | 563,854 | 14.2% |
[ 28.5% - 29.0% ] 28.70% | 351,445 | 12.3% |
[ 29.0% - 29.5% ] 29.30% | 787,931 | 11.8% |
[ 29.5% - 30.0% ] 29.78% | 563,029 | 9.5% |
[ 30.0% - 30.5% ] 30.26% | 497,342 | 12.2% |
[ 30.5% - 31.0% ] 30.82% | 231,996 | 12.4% |
[ 31.0% - 31.5% ] 31.17% | 205,765 | 12.8% |
[ 31.5% - 32.0% ] 31.73% | 995,424 | 11.8% |
[ 32.0% - 32.5% ] 32.25% | 275,768 | 11.6% |
[ 32.5% - 33.0% ] 32.68% | 369,054 | 12.8% |
[ 33.0% - 33.5% ] 33.38% | 211,948 | 12.8% |
[ 33.5% - 34.0% ] 33.79% | 382,181 | 10.9% |
[ 34.0% - 34.5% ] 34.40% | 202,237 | 17.2% |
[ 34.5% - 35.0% ] 34.70% | 166,741 | 10.2% |
[ 35.0% - 35.5% ] 35.21% | 61,528 | 11.8% |
[ 35.5% - 36.0% ] 35.63% | 139,457 | 17.4% |
[ 36.0% - 36.5% ] 36.36% | 309,978 | 10.2% |
[ 36.5% - 37.0% ] 36.73% | 334,201 | 10.8% |
[ 37.0% - 37.5% ] 37.31% | 192,048 | 13.1% |
[ 37.5% - 38.0% ] 37.80% | 226,971 | 14.3% |
[ 38.0% - 38.5% ] 38.25% | 201,116 | 9.9% |
[ 38.5% - 39.0% ] 38.69% | 145,308 | 7.2% |
[ 39.0% - 39.5% ] 39.32% | 151,502 | 6.7% |
[ 39.5% - 40.0% ] 39.69% | 289,960 | 13.7% |
[ 40.0% - 40.5% ] 40.20% | 127,958 | 10.9% |
[ 40.5% - 41.0% ] 40.73% | 258,739 | 9.6% |
[ 41.0% - 41.5% ] 41.33% | 25,710 | 14.8% |
[ 41.5% - 42.0% ] 41.71% | 208,338 | 9.3% |
[ 42.0% - 42.5% ] 42.14% | 82,608 | 7.2% |
[ 42.5% - 43.0% ] 42.72% | 5,555 | 13.6% |
[ 43.0% - 43.5% ] 43.44% | 49,238 | 10.9% |
[ 43.5% - 44.0% ] 43.67% | 110,192 | 8.9% |
[ 44.0% - 44.5% ] 44.29% | 260,643 | 11.0% |
[ 44.5% - 45.0% ] 44.81% | 44,872 | 11.2% |
[ 45.0% - 45.5% ] 45.27% | 19,178 | 6.3% |
[ 45.5% - 46.0% ] 45.81% | 81,325 | 10.7% |
[ 46.0% - 46.5% ] 46.24% | 9,078 | 9.3% |
[ 46.5% - 47.0% ] 46.88% | 58,374 | 12.0% |
[ 47.5% - 48.0% ] 47.62% | 504 | 16.9% |
[ 48.0% - 48.5% ] 48.23% | 3,840 | 24.1% |
[ 48.5% - 49.0% ] 48.71% | 10,108 | 7.6% |
[ 49.5% - 50.0% ] 49.74% | 1,166 | 6.6% |
[ 50.0% - 50.5% ] 50.37% | 19,115 | 7.5% |
[ 50.5% - 51.0% ] 50.67% | 1,352 | 9.1% |
[ 51.0% - 51.5% ] 51.33% | 5,922 | 16.4% |
[ 51.5% - 52.0% ] 51.90% | 13,841 | 9.2% |
[ 52.0% - 52.5% ] 52.40% | 1,540 | 14.6% |
[ 53.0% - 53.5% ] 53.45% | 3,422 | 7.7% |
[ 54.0% - 54.5% ] 54.00% | 50 | 46.4% |
[ 54.0% - 54.5% ] 54.39% | 22,889 | 5.6% |
[ 54.5% - 55.0% ] 54.55% | 132 | 22.9% |
[ 55.0% - 55.5% ] 55.44% | 3,191 | 13.7% |
[ 56.0% - 56.5% ] 56.32% | 14,541 | 7.7% |
[ 57.5% - 58.0% ] 57.58% | 1,023 | 14.9% |
[ 58.0% - 58.5% ] 58.24% | 182 | 27.8% |
[ 58.5% - 59.0% ] 58.58% | 7,689 | 9.1% |
[ 62.0% - 62.5% ] 62.09% | 153 | 17.9% |
[ 62.5% - 63.0% ] 62.93% | 1,748 | 34.1% |
[ 64.5% - 65.0% ] 64.84% | 1,061 | 2.8% |
[ 77.0% - 77.5% ] 77.38% | 84 | 47.1% |