Serbian 4 or more Vehicles in Household

COMPARE

Serbian
Race
Ancestry
AfghanAfricanAlaska NativeAlaskan AthabascanAlbanianAleutAlsatianAmericanApacheArabArapahoArgentineanArmenianAssyrian/Chaldean/SyriacAustralianAustrianBahamianBangladeshiBarbadianBasqueBelgianBelizeanBermudanBhutaneseBlackfeetBolivianBrazilianBritishBritish West IndianBulgarianBurmeseCajunCambodianCanadianCape VerdeanCarpatho RusynCelticCentral AmericanCentral American IndianCherokeeCheyenneChickasawChileanChineseChippewaChoctawColombianColvilleComancheCosta RicanCreeCreekCroatianCrowCubanCypriotCzechCzechoslovakianDanishDelawareDominicanDutchDutch West IndianEastern EuropeanEcuadorianEgyptianEnglishEstonianEthiopianEuropeanFijianFilipinoFinnishFrenchFrench American IndianFrench CanadianGermanGerman RussianGhanaianGreekGuamanian/ChamorroGuatemalanGuyaneseHaitianHmongHonduranHopiHoumaHungarianIcelanderIndian (Asian)IndonesianInupiatIranianIraqiIrishIroquoisIsraeliItalianJamaicanJapaneseJordanianKenyanKiowaKoreanLaotianLatvianLebaneseLiberianLithuanianLumbeeLuxembourgerMacedonianMalaysianMalteseMarshalleseMenomineeMexicanMexican American IndianMongolianMoroccanNative HawaiianNavajoNepaleseNew ZealanderNicaraguanNigerianNorthern EuropeanNorwegianOkinawanOsageOttawaPaiutePakistaniPalestinianPanamanianParaguayanPennsylvania GermanPeruvianPimaPolishPortuguesePotawatomiPuebloPuerto RicanPuget Sound SalishRomanianRussianSalvadoranSamoanScandinavianScotch-IrishScottishSeminoleSenegaleseSerbianShoshoneSierra LeoneanSiouxSlavicSlovakSloveneSomaliSouth AfricanSouth AmericanSouth American IndianSoviet UnionSpaniardSpanishSpanish AmericanSpanish American IndianSri LankanSubsaharan AfricanSudaneseSwedishSwissSyrianTaiwaneseThaiTlingit-HaidaTohono O'OdhamTonganTrinidadian and TobagonianTsimshianTurkishU.S. Virgin IslanderUgandanUkrainianUruguayanUteVenezuelanVietnameseWelshWest IndianYakamaYaquiYugoslavianYumanYup'ikZimbabwean
Immigration
NonimmigrantsImmigrantsAfghanistanAfricaAlbaniaArgentinaArmeniaAsiaAustraliaAustriaBahamasBangladeshBarbadosBelarusBelgiumBelizeBoliviaBosnia and HerzegovinaBrazilBulgariaBurma/MyanmarCabo VerdeCambodiaCameroonCanadaCaribbeanCentral AmericaChileChinaColombiaCongoCosta RicaCroatiaCubaCzechoslovakiaDenmarkDominicaDominican RepublicEastern AfricaEastern AsiaEastern EuropeEcuadorEgyptEl SalvadorEnglandEritreaEthiopiaEuropeFijiFranceGermanyGhanaGreeceGrenadaGuatemalaGuyanaHaitiHondurasHong KongHungaryIndiaIndonesiaIranIraqIrelandIsraelItalyJamaicaJapanJordanKazakhstanKenyaKoreaKuwaitLaosLatin AmericaLatviaLebanonLiberiaLithuaniaMalaysiaMexicoMicronesiaMiddle AfricaMoldovaMoroccoNepalNetherlandsNicaraguaNigeriaNorth AmericaNorth MacedoniaNorthern AfricaNorthern EuropeNorwayOceaniaPakistanPanamaPeruPhilippinesPolandPortugalRomaniaRussiaSaudi ArabiaScotlandSenegalSerbiaSierra LeoneSingaporeSomaliaSouth AfricaSouth AmericaSouth Central AsiaSouth Eastern AsiaSouthern EuropeSpainSri LankaSt. Vincent and the GrenadinesSudanSwedenSwitzerlandSyriaTaiwanThailandTrinidad and TobagoTurkeyUgandaUkraineUruguayUzbekistanVenezuelaVietnamWest IndiesWestern AfricaWestern AsiaWestern EuropeYemenZaireZimbabweAzores
Select to Compare
Race
Ancestry
AfghanAfricanAlaska NativeAlaskan AthabascanAlbanianAleutAlsatianAmericanApacheArabArapahoArgentineanArmenianAssyrian/Chaldean/SyriacAustralianAustrianBahamianBangladeshiBarbadianBasqueBelgianBelizeanBermudanBhutaneseBlackfeetBolivianBrazilianBritishBritish West IndianBulgarianBurmeseCajunCambodianCanadianCape VerdeanCarpatho RusynCelticCentral AmericanCentral American IndianCherokeeCheyenneChickasawChileanChineseChippewaChoctawColombianColvilleComancheCosta RicanCreeCreekCroatianCrowCubanCypriotCzechCzechoslovakianDanishDelawareDominicanDutchDutch West IndianEastern EuropeanEcuadorianEgyptianEnglishEstonianEthiopianEuropeanFijianFilipinoFinnishFrenchFrench American IndianFrench CanadianGermanGerman RussianGhanaianGreekGuamanian/ChamorroGuatemalanGuyaneseHaitianHmongHonduranHopiHoumaHungarianIcelanderIndian (Asian)IndonesianInupiatIranianIraqiIrishIroquoisIsraeliItalianJamaicanJapaneseJordanianKenyanKiowaKoreanLaotianLatvianLebaneseLiberianLithuanianLumbeeLuxembourgerMacedonianMalaysianMalteseMarshalleseMenomineeMexicanMexican American IndianMongolianMoroccanNative HawaiianNavajoNepaleseNew ZealanderNicaraguanNigerianNorthern EuropeanNorwegianOkinawanOsageOttawaPaiutePakistaniPalestinianPanamanianParaguayanPennsylvania GermanPeruvianPimaPolishPortuguesePotawatomiPuebloPuerto RicanPuget Sound SalishRomanianRussianSalvadoranSamoanScandinavianScotch-IrishScottishSeminoleSenegaleseShoshoneSierra LeoneanSiouxSlavicSlovakSloveneSomaliSouth AfricanSouth AmericanSouth American IndianSoviet UnionSpaniardSpanishSpanish AmericanSpanish American IndianSri LankanSubsaharan AfricanSudaneseSwedishSwissSyrianTaiwaneseThaiTlingit-HaidaTohono O'OdhamTonganTrinidadian and TobagonianTsimshianTurkishU.S. Virgin IslanderUgandanUkrainianUruguayanUteVenezuelanVietnameseWelshWest IndianYakamaYaquiYugoslavianYumanYup'ikZimbabwean
Immigration
NonimmigrantsImmigrantsAfghanistanAfricaAlbaniaArgentinaArmeniaAsiaAustraliaAustriaBahamasBangladeshBarbadosBelarusBelgiumBelizeBoliviaBosnia and HerzegovinaBrazilBulgariaBurma/MyanmarCabo VerdeCambodiaCameroonCanadaCaribbeanCentral AmericaChileChinaColombiaCongoCosta RicaCroatiaCubaCzechoslovakiaDenmarkDominicaDominican RepublicEastern AfricaEastern AsiaEastern EuropeEcuadorEgyptEl SalvadorEnglandEritreaEthiopiaEuropeFijiFranceGermanyGhanaGreeceGrenadaGuatemalaGuyanaHaitiHondurasHong KongHungaryIndiaIndonesiaIranIraqIrelandIsraelItalyJamaicaJapanJordanKazakhstanKenyaKoreaKuwaitLaosLatin AmericaLatviaLebanonLiberiaLithuaniaMalaysiaMexicoMicronesiaMiddle AfricaMoldovaMoroccoNepalNetherlandsNicaraguaNigeriaNorth AmericaNorth MacedoniaNorthern AfricaNorthern EuropeNorwayOceaniaPakistanPanamaPeruPhilippinesPolandPortugalRomaniaRussiaSaudi ArabiaScotlandSenegalSerbiaSierra LeoneSingaporeSomaliaSouth AfricaSouth AmericaSouth Central AsiaSouth Eastern AsiaSouthern EuropeSpainSri LankaSt. Vincent and the GrenadinesSudanSwedenSwitzerlandSyriaTaiwanThailandTrinidad and TobagoTurkeyUgandaUkraineUruguayUzbekistanVenezuelaVietnamWest IndiesWestern AfricaWestern AsiaWestern EuropeYemenZaireZimbabweAzores
4 or more Vehicles in Household
Income
Poverty
Unemployment
Labor Participation
Family Structure
Vehicle Availability
Education Level
Disability

Serbian 4 or more Vehicles in Household
Poor

6.0%
4+ VEHICLES AVAILABLE
11.0/ 100
METRIC RATING
219th/ 347
METRIC RANK

Serbian 4 or more Vehicles in Household Correlation Chart

The statistical analysis conducted on geographies consisting of 266,656,513 people shows a mild positive correlation between the proportion of Serbians and percentage of households with 4 or more vehicles available in the United States with a correlation coefficient (R) of 0.343 and weighted average of 6.0%. On average, for every 1% (one percent) increase in Serbians within a typical geography, there is an increase of 0.53% in percentage of households with 4 or more vehicles available.
Serbian 4 or more Vehicles in Household
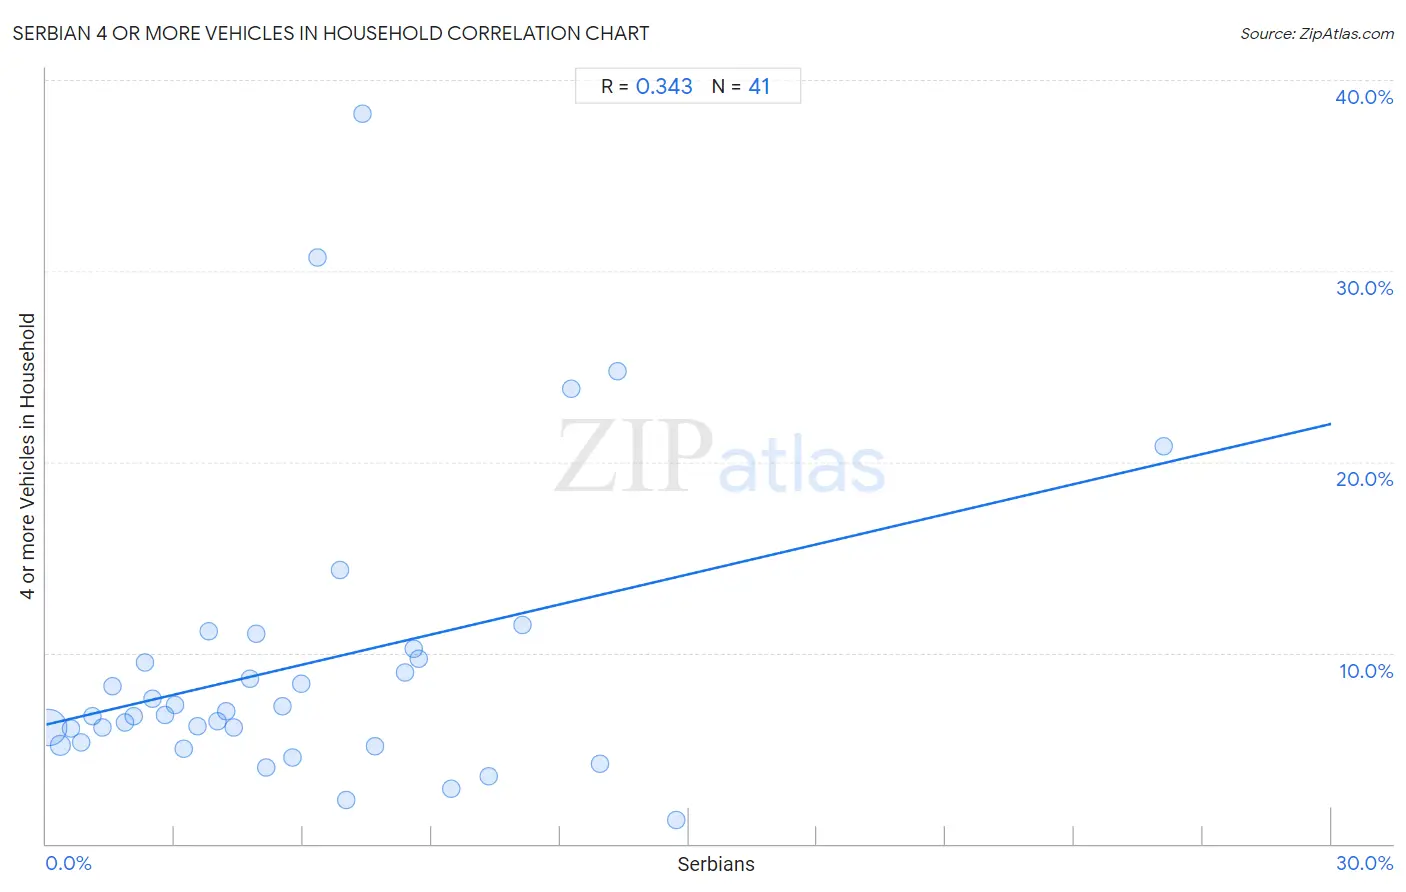
It is essential to understand that the correlation between the percentage of Serbians and percentage of households with 4 or more vehicles available does not imply a direct cause-and-effect relationship. It remains uncertain whether the presence of Serbians influences an upward or downward trend in the level of percentage of households with 4 or more vehicles available within an area, or if Serbians simply ended up residing in those areas with higher or lower levels of percentage of households with 4 or more vehicles available due to other factors.

Demographics Similar to Serbians by 4 or more Vehicles in Household

In terms of 4 or more vehicles in household, the demographic groups most similar to Serbians are Immigrants from Italy (6.0%, a difference of 0.0%), Russian (6.0%, a difference of 0.19%), Nigerian (6.0%, a difference of 0.31%), Immigrants from Moldova (6.0%, a difference of 0.49%), and Cajun (6.0%, a difference of 0.52%).
DemographicsRating | Rank4 or more Vehicles in Household
Immigrants from Egypt
14.7
/100
|
#212
Poor
6.0%
Arabs
14.4
/100
|
#213
Poor
6.0%
Immigrants from Austria
14.3
/100
|
#214
Poor
6.0%
Immigrants from China
13.8
/100
|
#215
Poor
6.0%
Immigrants from Romania
13.8
/100
|
#216
Poor
6.0%
Nigerians
12.2
/100
|
#217
Poor
6.0%
Immigrants from Italy
11.0
/100
|
#218
Poor
6.0%
Serbians
11.0
/100
|
#219
Poor
6.0%
Russians
10.3
/100
|
#220
Poor
6.0%
Immigrants from Moldova
9.3
/100
|
#221
Tragic
6.0%
Cajuns
9.2
/100
|
#222
Tragic
6.0%
Immigrants from Kenya
9.2
/100
|
#223
Tragic
6.0%
Cubans
9.2
/100
|
#224
Tragic
6.0%
Indonesians
8.9
/100
|
#225
Tragic
6.0%
Immigrants from Singapore
7.9
/100
|
#226
Tragic
5.9%

Serbian 4 or more Vehicles in Household Correlation Summary

MeasurementSerbian Data4 or more Vehicles in Household Data
Minimum0.068%1.2%
Maximum26.1%38.2%
Range26.0%37.0%
Mean6.0%9.4%
Median4.9%6.7%
Interquartile 25% (IQ1)2.4%5.2%
Interquartile 75% (IQ3)8.5%10.0%
Interquartile Range (IQR)6.1%4.7%
Standard Deviation (Sample)5.0%7.7%
Standard Deviation (Population)4.9%7.6%

Correlation Details

Serbian PercentileSample Size4 or more Vehicles in Household
[
0.0%
-
0.5%
]
0.068%
231,805,7146.1%
[
0.0%
-
0.5%
]
0.32%
22,423,0765.2%
[
0.5%
-
1.0%
]
0.58%
5,938,9056.0%
[
0.5%
-
1.0%
]
0.83%
2,538,0135.3%
[
1.0%
-
1.5%
]
1.09%
1,525,6036.7%
[
1.0%
-
1.5%
]
1.32%
798,3206.1%
[
1.5%
-
2.0%
]
1.56%
331,2968.3%
[
1.5%
-
2.0%
]
1.83%
586,1456.3%
[
2.0%
-
2.5%
]
2.05%
263,0456.6%
[
2.0%
-
2.5%
]
2.30%
76,4119.5%
[
2.0%
-
2.5%
]
2.48%
97,7737.6%
[
2.5%
-
3.0%
]
2.78%
38,2116.7%
[
3.0%
-
3.5%
]
3.02%
22,1057.3%
[
3.0%
-
3.5%
]
3.21%
28,3155.0%
[
3.5%
-
4.0%
]
3.53%
40,7556.2%
[
3.5%
-
4.0%
]
3.80%
4,99911.1%
[
3.5%
-
4.0%
]
3.99%
48,5946.4%
[
4.0%
-
4.5%
]
4.21%
42,0327.0%
[
4.0%
-
4.5%
]
4.37%
4,7586.1%
[
4.5%
-
5.0%
]
4.76%
5,3738.7%
[
4.5%
-
5.0%
]
4.89%
1,83911.0%
[
5.0%
-
5.5%
]
5.13%
6,9554.0%
[
5.5%
-
6.0%
]
5.52%
3,7487.2%
[
5.5%
-
6.0%
]
5.74%
3834.5%
[
5.5%
-
6.0%
]
5.96%
4,3778.4%
[
6.0%
-
6.5%
]
6.34%
1,13630.7%
[
6.5%
-
7.0%
]
6.84%
5,52314.4%
[
7.0%
-
7.5%
]
7.01%
9842.3%
[
7.0%
-
7.5%
]
7.39%
89338.2%
[
7.5%
-
8.0%
]
7.68%
1,7715.1%
[
8.0%
-
8.5%
]
8.38%
3349.0%
[
8.5%
-
9.0%
]
8.58%
2,20310.2%
[
8.5%
-
9.0%
]
8.70%
2999.7%
[
9.0%
-
9.5%
]
9.44%
1,8852.9%
[
10.0%
-
10.5%
]
10.33%
1,4723.5%
[
11.0%
-
11.5%
]
11.11%
9911.4%
[
12.0%
-
12.5%
]
12.24%
29423.8%
[
12.5%
-
13.0%
]
12.92%
3254.2%
[
13.0%
-
13.5%
]
13.33%
1,44824.7%
[
14.5%
-
15.0%
]
14.71%
1,0331.2%
[
26.0%
-
26.5%
]
26.09%
6920.8%