Armenian 4 or more Vehicles in Household

COMPARE

Armenian
Race
Ancestry
AfghanAfricanAlaska NativeAlaskan AthabascanAlbanianAleutAlsatianAmericanApacheArabArapahoArgentineanArmenianAssyrian/Chaldean/SyriacAustralianAustrianBahamianBangladeshiBarbadianBasqueBelgianBelizeanBermudanBhutaneseBlackfeetBolivianBrazilianBritishBritish West IndianBulgarianBurmeseCajunCambodianCanadianCape VerdeanCarpatho RusynCelticCentral AmericanCentral American IndianCherokeeCheyenneChickasawChileanChineseChippewaChoctawColombianColvilleComancheCosta RicanCreeCreekCroatianCrowCubanCypriotCzechCzechoslovakianDanishDelawareDominicanDutchDutch West IndianEastern EuropeanEcuadorianEgyptianEnglishEstonianEthiopianEuropeanFijianFilipinoFinnishFrenchFrench American IndianFrench CanadianGermanGerman RussianGhanaianGreekGuamanian/ChamorroGuatemalanGuyaneseHaitianHmongHonduranHopiHoumaHungarianIcelanderIndian (Asian)IndonesianInupiatIranianIraqiIrishIroquoisIsraeliItalianJamaicanJapaneseJordanianKenyanKiowaKoreanLaotianLatvianLebaneseLiberianLithuanianLumbeeLuxembourgerMacedonianMalaysianMalteseMarshalleseMenomineeMexicanMexican American IndianMongolianMoroccanNative HawaiianNavajoNepaleseNew ZealanderNicaraguanNigerianNorthern EuropeanNorwegianOkinawanOsageOttawaPaiutePakistaniPalestinianPanamanianParaguayanPennsylvania GermanPeruvianPimaPolishPortuguesePotawatomiPuebloPuerto RicanPuget Sound SalishRomanianRussianSalvadoranSamoanScandinavianScotch-IrishScottishSeminoleSenegaleseSerbianShoshoneSierra LeoneanSiouxSlavicSlovakSloveneSomaliSouth AfricanSouth AmericanSouth American IndianSoviet UnionSpaniardSpanishSpanish AmericanSpanish American IndianSri LankanSubsaharan AfricanSudaneseSwedishSwissSyrianTaiwaneseThaiTlingit-HaidaTohono O'OdhamTonganTrinidadian and TobagonianTsimshianTurkishU.S. Virgin IslanderUgandanUkrainianUruguayanUteVenezuelanVietnameseWelshWest IndianYakamaYaquiYugoslavianYumanYup'ikZimbabwean
Immigration
NonimmigrantsImmigrantsAfghanistanAfricaAlbaniaArgentinaArmeniaAsiaAustraliaAustriaBahamasBangladeshBarbadosBelarusBelgiumBelizeBoliviaBosnia and HerzegovinaBrazilBulgariaBurma/MyanmarCabo VerdeCambodiaCameroonCanadaCaribbeanCentral AmericaChileChinaColombiaCongoCosta RicaCroatiaCubaCzechoslovakiaDenmarkDominicaDominican RepublicEastern AfricaEastern AsiaEastern EuropeEcuadorEgyptEl SalvadorEnglandEritreaEthiopiaEuropeFijiFranceGermanyGhanaGreeceGrenadaGuatemalaGuyanaHaitiHondurasHong KongHungaryIndiaIndonesiaIranIraqIrelandIsraelItalyJamaicaJapanJordanKazakhstanKenyaKoreaKuwaitLaosLatin AmericaLatviaLebanonLiberiaLithuaniaMalaysiaMexicoMicronesiaMiddle AfricaMoldovaMoroccoNepalNetherlandsNicaraguaNigeriaNorth AmericaNorth MacedoniaNorthern AfricaNorthern EuropeNorwayOceaniaPakistanPanamaPeruPhilippinesPolandPortugalRomaniaRussiaSaudi ArabiaScotlandSenegalSerbiaSierra LeoneSingaporeSomaliaSouth AfricaSouth AmericaSouth Central AsiaSouth Eastern AsiaSouthern EuropeSpainSri LankaSt. Vincent and the GrenadinesSudanSwedenSwitzerlandSyriaTaiwanThailandTrinidad and TobagoTurkeyUgandaUkraineUruguayUzbekistanVenezuelaVietnamWest IndiesWestern AfricaWestern AsiaWestern EuropeYemenZaireZimbabweAzores
Select to Compare
Race
Ancestry
AfghanAfricanAlaska NativeAlaskan AthabascanAlbanianAleutAlsatianAmericanApacheArabArapahoArgentineanAssyrian/Chaldean/SyriacAustralianAustrianBahamianBangladeshiBarbadianBasqueBelgianBelizeanBermudanBhutaneseBlackfeetBolivianBrazilianBritishBritish West IndianBulgarianBurmeseCajunCambodianCanadianCape VerdeanCarpatho RusynCelticCentral AmericanCentral American IndianCherokeeCheyenneChickasawChileanChineseChippewaChoctawColombianColvilleComancheCosta RicanCreeCreekCroatianCrowCubanCypriotCzechCzechoslovakianDanishDelawareDominicanDutchDutch West IndianEastern EuropeanEcuadorianEgyptianEnglishEstonianEthiopianEuropeanFijianFilipinoFinnishFrenchFrench American IndianFrench CanadianGermanGerman RussianGhanaianGreekGuamanian/ChamorroGuatemalanGuyaneseHaitianHmongHonduranHopiHoumaHungarianIcelanderIndian (Asian)IndonesianInupiatIranianIraqiIrishIroquoisIsraeliItalianJamaicanJapaneseJordanianKenyanKiowaKoreanLaotianLatvianLebaneseLiberianLithuanianLumbeeLuxembourgerMacedonianMalaysianMalteseMarshalleseMenomineeMexicanMexican American IndianMongolianMoroccanNative HawaiianNavajoNepaleseNew ZealanderNicaraguanNigerianNorthern EuropeanNorwegianOkinawanOsageOttawaPaiutePakistaniPalestinianPanamanianParaguayanPennsylvania GermanPeruvianPimaPolishPortuguesePotawatomiPuebloPuerto RicanPuget Sound SalishRomanianRussianSalvadoranSamoanScandinavianScotch-IrishScottishSeminoleSenegaleseSerbianShoshoneSierra LeoneanSiouxSlavicSlovakSloveneSomaliSouth AfricanSouth AmericanSouth American IndianSoviet UnionSpaniardSpanishSpanish AmericanSpanish American IndianSri LankanSubsaharan AfricanSudaneseSwedishSwissSyrianTaiwaneseThaiTlingit-HaidaTohono O'OdhamTonganTrinidadian and TobagonianTsimshianTurkishU.S. Virgin IslanderUgandanUkrainianUruguayanUteVenezuelanVietnameseWelshWest IndianYakamaYaquiYugoslavianYumanYup'ikZimbabwean
Immigration
NonimmigrantsImmigrantsAfghanistanAfricaAlbaniaArgentinaArmeniaAsiaAustraliaAustriaBahamasBangladeshBarbadosBelarusBelgiumBelizeBoliviaBosnia and HerzegovinaBrazilBulgariaBurma/MyanmarCabo VerdeCambodiaCameroonCanadaCaribbeanCentral AmericaChileChinaColombiaCongoCosta RicaCroatiaCubaCzechoslovakiaDenmarkDominicaDominican RepublicEastern AfricaEastern AsiaEastern EuropeEcuadorEgyptEl SalvadorEnglandEritreaEthiopiaEuropeFijiFranceGermanyGhanaGreeceGrenadaGuatemalaGuyanaHaitiHondurasHong KongHungaryIndiaIndonesiaIranIraqIrelandIsraelItalyJamaicaJapanJordanKazakhstanKenyaKoreaKuwaitLaosLatin AmericaLatviaLebanonLiberiaLithuaniaMalaysiaMexicoMicronesiaMiddle AfricaMoldovaMoroccoNepalNetherlandsNicaraguaNigeriaNorth AmericaNorth MacedoniaNorthern AfricaNorthern EuropeNorwayOceaniaPakistanPanamaPeruPhilippinesPolandPortugalRomaniaRussiaSaudi ArabiaScotlandSenegalSerbiaSierra LeoneSingaporeSomaliaSouth AfricaSouth AmericaSouth Central AsiaSouth Eastern AsiaSouthern EuropeSpainSri LankaSt. Vincent and the GrenadinesSudanSwedenSwitzerlandSyriaTaiwanThailandTrinidad and TobagoTurkeyUgandaUkraineUruguayUzbekistanVenezuelaVietnamWest IndiesWestern AfricaWestern AsiaWestern EuropeYemenZaireZimbabweAzores
4 or more Vehicles in Household
Income
Poverty
Unemployment
Labor Participation
Family Structure
Vehicle Availability
Education Level
Disability

Armenian 4 or more Vehicles in Household
Excellent

6.6%
4+ VEHICLES AVAILABLE
86.9/ 100
METRIC RATING
133rd/ 347
METRIC RANK

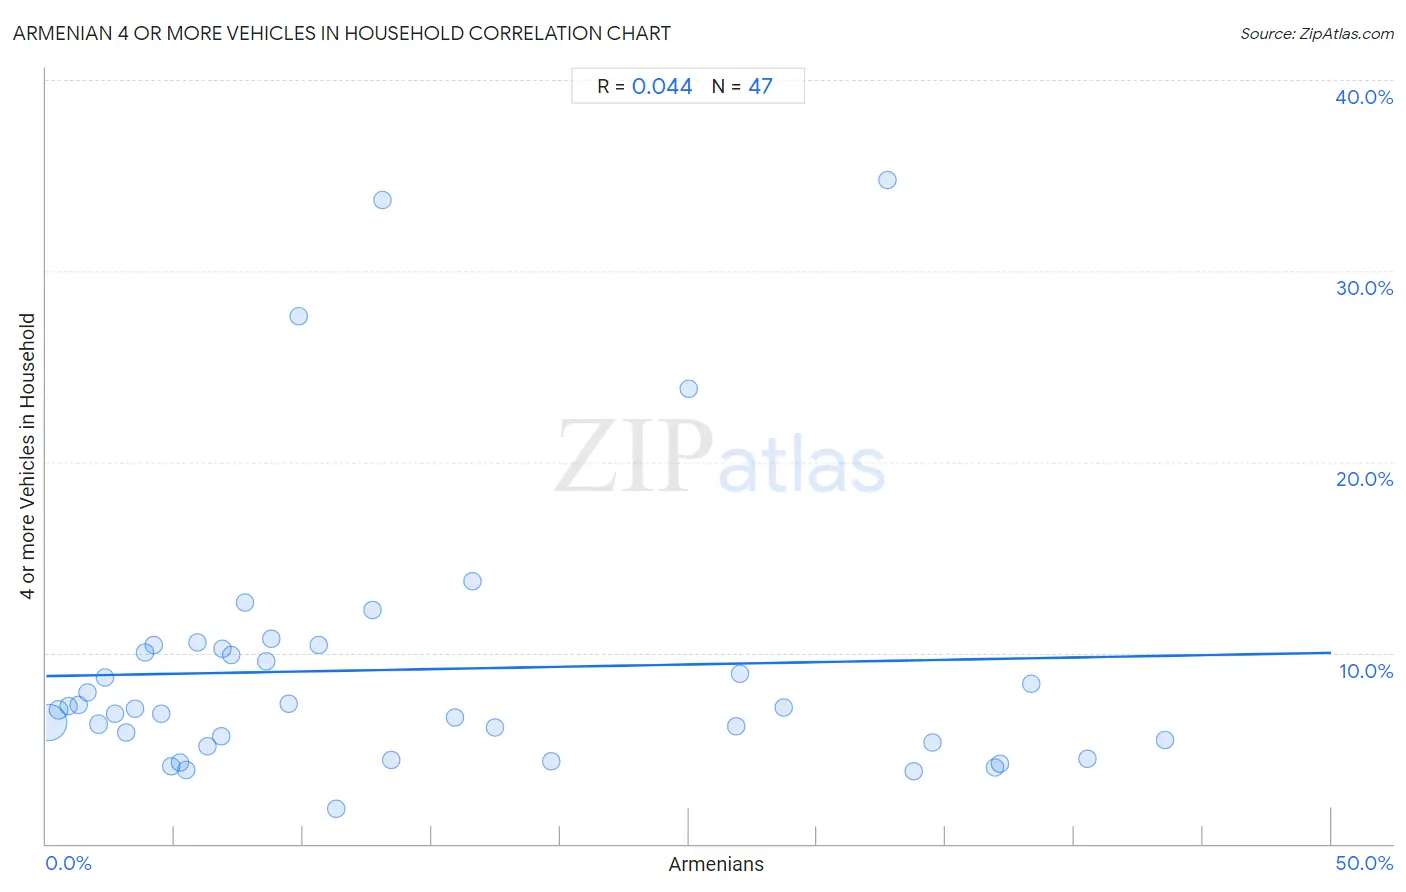
Armenian 4 or more Vehicles in Household Correlation Chart

The statistical analysis conducted on geographies consisting of 309,582,148 people shows no correlation between the proportion of Armenians and percentage of households with 4 or more vehicles available in the United States with a correlation coefficient (R) of 0.044 and weighted average of 6.6%. On average, for every 1% (one percent) increase in Armenians within a typical geography, there is an increase of 0.024% in percentage of households with 4 or more vehicles available.
Armenian 4 or more Vehicles in Household
It is essential to understand that the correlation between the percentage of Armenians and percentage of households with 4 or more vehicles available does not imply a direct cause-and-effect relationship. It remains uncertain whether the presence of Armenians influences an upward or downward trend in the level of percentage of households with 4 or more vehicles available within an area, or if Armenians simply ended up residing in those areas with higher or lower levels of percentage of households with 4 or more vehicles available due to other factors.

Demographics Similar to Armenians by 4 or more Vehicles in Household

In terms of 4 or more vehicles in household, the demographic groups most similar to Armenians are Ottawa (6.6%, a difference of 0.020%), Tohono O'odham (6.6%, a difference of 0.050%), Luxembourger (6.6%, a difference of 0.11%), Immigrants from Netherlands (6.6%, a difference of 0.19%), and French Canadian (6.6%, a difference of 0.32%).
DemographicsRating | Rank4 or more Vehicles in Household
Belgians
94.1
/100
|
#126
Exceptional
6.8%
Immigrants from Korea
93.8
/100
|
#127
Exceptional
6.8%
Immigrants from Bolivia
92.5
/100
|
#128
Exceptional
6.7%
Immigrants from England
92.0
/100
|
#129
Exceptional
6.7%
Immigrants from Scotland
89.0
/100
|
#130
Excellent
6.7%
Maltese
88.4
/100
|
#131
Excellent
6.7%
Immigrants from Netherlands
87.8
/100
|
#132
Excellent
6.6%
Armenians
86.9
/100
|
#133
Excellent
6.6%
Ottawa
86.9
/100
|
#134
Excellent
6.6%
Tohono O'odham
86.7
/100
|
#135
Excellent
6.6%
Luxembourgers
86.4
/100
|
#136
Excellent
6.6%
French Canadians
85.4
/100
|
#137
Excellent
6.6%
Italians
84.5
/100
|
#138
Excellent
6.6%
Jordanians
82.1
/100
|
#139
Excellent
6.6%
Slavs
81.6
/100
|
#140
Excellent
6.6%

Armenian 4 or more Vehicles in Household Correlation Summary

MeasurementArmenian Data4 or more Vehicles in Household Data
Minimum0.097%1.8%
Maximum43.5%34.8%
Range43.4%33.0%
Mean14.0%9.1%
Median8.8%7.1%
Interquartile 25% (IQ1)4.2%5.3%
Interquartile 75% (IQ3)25.0%10.2%
Interquartile Range (IQR)20.8%4.9%
Standard Deviation (Sample)12.8%7.1%
Standard Deviation (Population)12.7%7.0%

Correlation Details

Armenian PercentileSample Size4 or more Vehicles in Household
[
0.0%
-
0.5%
]
0.097%
269,394,4586.4%
[
0.0%
-
0.5%
]
0.49%
23,388,5967.0%
[
0.5%
-
1.0%
]
0.87%
5,313,5887.2%
[
1.0%
-
1.5%
]
1.24%
2,898,5057.3%
[
1.5%
-
2.0%
]
1.63%
848,0207.9%
[
2.0%
-
2.5%
]
2.02%
4,859,5176.3%
[
2.0%
-
2.5%
]
2.30%
514,8408.7%
[
2.5%
-
3.0%
]
2.68%
504,3356.8%
[
3.0%
-
3.5%
]
3.12%
111,7445.8%
[
3.0%
-
3.5%
]
3.45%
257,2697.1%
[
3.5%
-
4.0%
]
3.83%
26,36610.0%
[
4.0%
-
4.5%
]
4.18%
69,51710.4%
[
4.0%
-
4.5%
]
4.45%
111,8716.8%
[
4.5%
-
5.0%
]
4.87%
31,0334.1%
[
5.0%
-
5.5%
]
5.22%
90,5614.2%
[
5.0%
-
5.5%
]
5.46%
108,4953.9%
[
5.5%
-
6.0%
]
5.90%
88,79710.6%
[
6.0%
-
6.5%
]
6.27%
8295.1%
[
6.5%
-
7.0%
]
6.80%
60,3455.6%
[
6.5%
-
7.0%
]
6.86%
44,24410.2%
[
7.0%
-
7.5%
]
7.19%
20,0929.9%
[
7.5%
-
8.0%
]
7.74%
4,37812.6%
[
8.5%
-
9.0%
]
8.54%
72,4219.6%
[
8.5%
-
9.0%
]
8.76%
145,22710.7%
[
9.0%
-
9.5%
]
9.41%
43,5527.3%
[
9.5%
-
10.0%
]
9.83%
86527.6%
[
10.5%
-
11.0%
]
10.62%
51,65410.4%
[
11.0%
-
11.5%
]
11.28%
1331.8%
[
12.5%
-
13.0%
]
12.69%
33,16312.2%
[
13.0%
-
13.5%
]
13.08%
65033.7%
[
13.0%
-
13.5%
]
13.41%
27,5234.4%
[
15.5%
-
16.0%
]
15.89%
2,6446.6%
[
16.5%
-
17.0%
]
16.58%
20,91113.7%
[
17.0%
-
17.5%
]
17.46%
8,2096.1%
[
19.5%
-
20.0%
]
19.65%
12,3124.3%
[
25.0%
-
25.5%
]
25.00%
7223.8%
[
26.5%
-
27.0%
]
26.83%
45,5646.2%
[
26.5%
-
27.0%
]
26.98%
15,4658.9%
[
28.5%
-
29.0%
]
28.71%
18,9517.2%
[
32.5%
-
33.0%
]
32.71%
10734.8%
[
33.5%
-
34.0%
]
33.78%
16,6793.8%
[
34.5%
-
35.0%
]
34.51%
194,5125.3%
[
36.5%
-
37.0%
]
36.93%
32,2944.0%
[
37.0%
-
37.5%
]
37.12%
35,7554.2%
[
38.0%
-
38.5%
]
38.33%
11,0918.4%
[
40.5%
-
41.0%
]
40.51%
22,8314.5%
[
43.5%
-
44.0%
]
43.52%
22,1635.4%