Marshallese 4 or more Vehicles in Household
COMPARE
Marshallese
Select to Compare
4 or more Vehicles in Household
Marshallese 4 or more Vehicles in Household
8.1%
4+ VEHICLES AVAILABLE
100.0/ 100
METRIC RATING
32nd/ 347
METRIC RANK
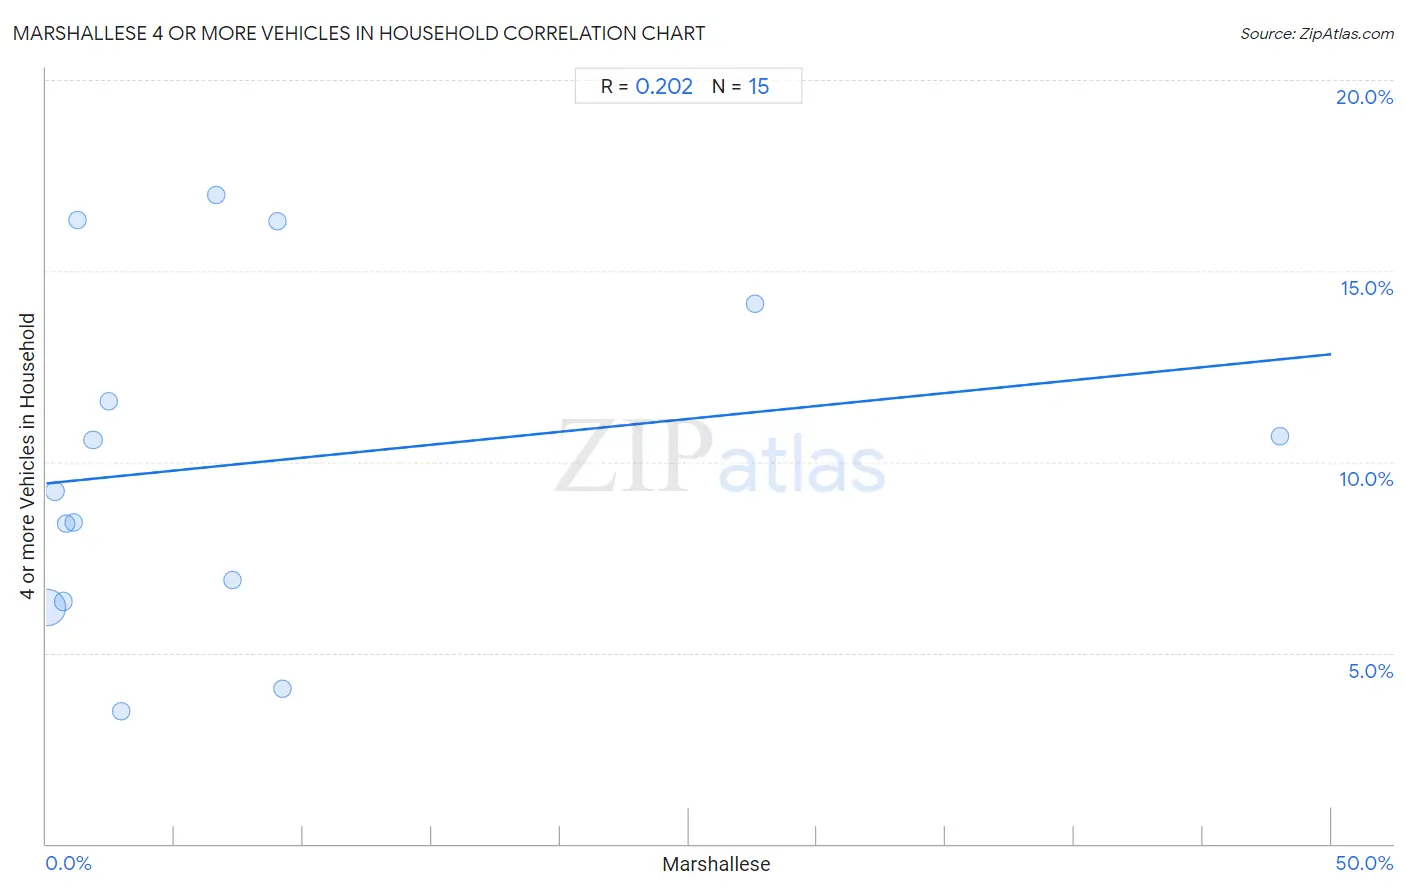
Marshallese 4 or more Vehicles in Household Correlation Chart
The statistical analysis conducted on geographies consisting of 14,760,409 people shows a weak positive correlation between the proportion of Marshallese and percentage of households with 4 or more vehicles available in the United States with a correlation coefficient (R) of 0.202 and weighted average of 8.1%. On average, for every 1% (one percent) increase in Marshallese within a typical geography, there is an increase of 0.068% in percentage of households with 4 or more vehicles available.
It is essential to understand that the correlation between the percentage of Marshallese and percentage of households with 4 or more vehicles available does not imply a direct cause-and-effect relationship. It remains uncertain whether the presence of Marshallese influences an upward or downward trend in the level of percentage of households with 4 or more vehicles available within an area, or if Marshallese simply ended up residing in those areas with higher or lower levels of percentage of households with 4 or more vehicles available due to other factors.
Demographics Similar to Marshallese by 4 or more Vehicles in Household
In terms of 4 or more vehicles in household, the demographic groups most similar to Marshallese are Yaqui (8.1%, a difference of 0.29%), Native/Alaskan (8.2%, a difference of 0.53%), Alaskan Athabascan (8.1%, a difference of 0.89%), Navajo (8.2%, a difference of 0.94%), and Immigrants from South Eastern Asia (8.2%, a difference of 0.97%).
| Demographics | Rating | Rank | 4 or more Vehicles in Household |
| Basques | 100.0 /100 | #25 | Exceptional 8.4% |
| Mexican American Indians | 100.0 /100 | #26 | Exceptional 8.4% |
| Sri Lankans | 100.0 /100 | #27 | Exceptional 8.4% |
| Cheyenne | 100.0 /100 | #28 | Exceptional 8.3% |
| Immigrants from South Eastern Asia | 100.0 /100 | #29 | Exceptional 8.2% |
| Navajo | 100.0 /100 | #30 | Exceptional 8.2% |
| Natives/Alaskans | 100.0 /100 | #31 | Exceptional 8.2% |
| Marshallese | 100.0 /100 | #32 | Exceptional 8.1% |
| Yaqui | 100.0 /100 | #33 | Exceptional 8.1% |
| Alaskan Athabascans | 100.0 /100 | #34 | Exceptional 8.1% |
| Guamanians/Chamorros | 100.0 /100 | #35 | Exceptional 8.1% |
| Norwegians | 100.0 /100 | #36 | Exceptional 8.0% |
| Scandinavians | 100.0 /100 | #37 | Exceptional 8.0% |
| Sioux | 100.0 /100 | #38 | Exceptional 8.0% |
| Spanish Americans | 100.0 /100 | #39 | Exceptional 8.0% |
Marshallese 4 or more Vehicles in Household Correlation Summary
| Measurement | Marshallese Data | 4 or more Vehicles in Household Data |
| Minimum | 0.037% | 3.5% |
| Maximum | 48.0% | 17.0% |
| Range | 48.0% | 13.5% |
| Mean | 7.9% | 10.0% |
| Median | 2.5% | 9.2% |
| Interquartile 25% (IQ1) | 0.79% | 6.3% |
| Interquartile 75% (IQ3) | 9.0% | 14.1% |
| Interquartile Range (IQR) | 8.2% | 7.8% |
| Standard Deviation (Sample) | 13.1% | 4.4% |
| Standard Deviation (Population) | 12.7% | 4.2% |
Correlation Details
| Marshallese Percentile | Sample Size | 4 or more Vehicles in Household |
[ 0.0% - 0.5% ] 0.037% | 12,928,307 | 6.2% |
[ 0.0% - 0.5% ] 0.34% | 859,705 | 9.2% |
[ 0.5% - 1.0% ] 0.66% | 591,328 | 6.3% |
[ 0.5% - 1.0% ] 0.79% | 133,430 | 8.4% |
[ 1.0% - 1.5% ] 1.08% | 112,589 | 8.4% |
[ 1.0% - 1.5% ] 1.23% | 2,853 | 16.3% |
[ 1.5% - 2.0% ] 1.82% | 103,677 | 10.6% |
[ 2.0% - 2.5% ] 2.45% | 13,749 | 11.6% |
[ 2.5% - 3.0% ] 2.89% | 2,971 | 3.5% |
[ 6.5% - 7.0% ] 6.61% | 4,827 | 17.0% |
[ 7.0% - 7.5% ] 7.25% | 1,932 | 6.9% |
[ 8.5% - 9.0% ] 8.98% | 3,754 | 16.3% |
[ 9.0% - 9.5% ] 9.18% | 196 | 4.1% |
[ 27.5% - 28.0% ] 27.56% | 693 | 14.1% |
[ 47.5% - 48.0% ] 47.99% | 398 | 10.7% |