Estonian 4 or more Vehicles in Household
COMPARE
Estonian
Select to Compare
4 or more Vehicles in Household
Estonian 4 or more Vehicles in Household
6.4%
4+ VEHICLES AVAILABLE
55.1/ 100
METRIC RATING
169th/ 347
METRIC RANK
Estonian 4 or more Vehicles in Household Correlation Chart
The statistical analysis conducted on geographies consisting of 123,188,089 people shows a moderate positive correlation between the proportion of Estonians and percentage of households with 4 or more vehicles available in the United States with a correlation coefficient (R) of 0.469 and weighted average of 6.4%. On average, for every 1% (one percent) increase in Estonians within a typical geography, there is an increase of 1.7% in percentage of households with 4 or more vehicles available.
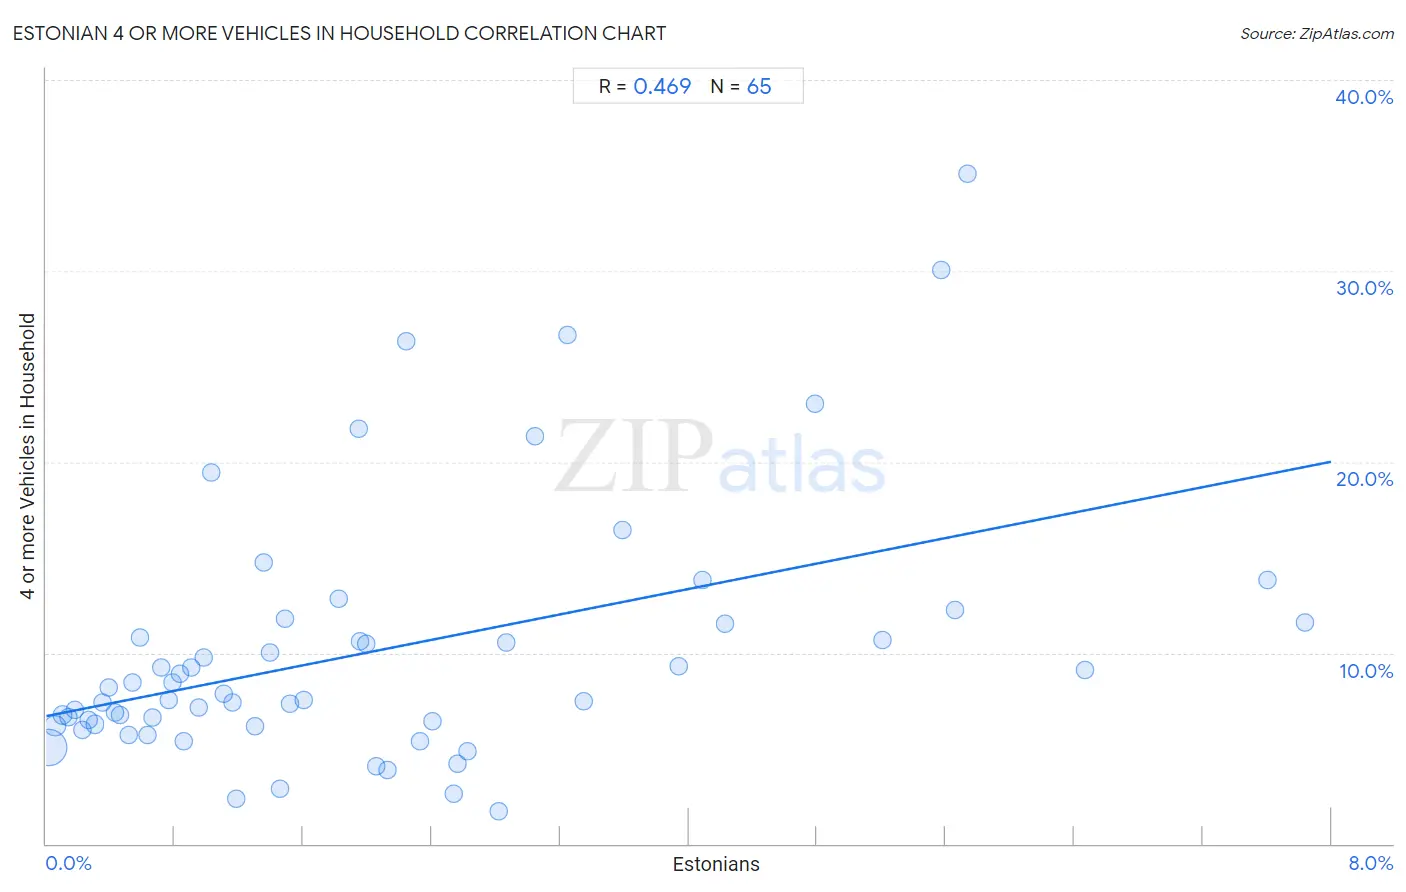
It is essential to understand that the correlation between the percentage of Estonians and percentage of households with 4 or more vehicles available does not imply a direct cause-and-effect relationship. It remains uncertain whether the presence of Estonians influences an upward or downward trend in the level of percentage of households with 4 or more vehicles available within an area, or if Estonians simply ended up residing in those areas with higher or lower levels of percentage of households with 4 or more vehicles available due to other factors.
Demographics Similar to Estonians by 4 or more Vehicles in Household
In terms of 4 or more vehicles in household, the demographic groups most similar to Estonians are Lebanese (6.4%, a difference of 0.070%), Polish (6.4%, a difference of 0.18%), Immigrants from Syria (6.3%, a difference of 0.24%), Immigrants from Denmark (6.4%, a difference of 0.28%), and Immigrants from India (6.3%, a difference of 0.32%).
| Demographics | Rating | Rank | 4 or more Vehicles in Household |
| Immigrants from Pakistan | 63.2 /100 | #162 | Good 6.4% |
| Chileans | 61.2 /100 | #163 | Good 6.4% |
| Hungarians | 61.1 /100 | #164 | Good 6.4% |
| Immigrants from Peru | 59.8 /100 | #165 | Average 6.4% |
| Immigrants from Denmark | 57.8 /100 | #166 | Average 6.4% |
| Poles | 56.9 /100 | #167 | Average 6.4% |
| Lebanese | 55.8 /100 | #168 | Average 6.4% |
| Estonians | 55.1 /100 | #169 | Average 6.4% |
| Immigrants from Syria | 52.8 /100 | #170 | Average 6.3% |
| Immigrants from India | 51.9 /100 | #171 | Average 6.3% |
| Immigrants from Lebanon | 51.7 /100 | #172 | Average 6.3% |
| Slovenes | 51.1 /100 | #173 | Average 6.3% |
| Lithuanians | 50.0 /100 | #174 | Average 6.3% |
| Immigrants from Western Europe | 48.8 /100 | #175 | Average 6.3% |
| Ukrainians | 47.6 /100 | #176 | Average 6.3% |
Estonian 4 or more Vehicles in Household Correlation Summary
| Measurement | Estonian Data | 4 or more Vehicles in Household Data |
| Minimum | 0.014% | 1.7% |
| Maximum | 7.8% | 35.1% |
| Range | 7.8% | 33.4% |
| Mean | 2.1% | 10.1% |
| Median | 1.5% | 7.9% |
| Interquartile 25% (IQ1) | 0.65% | 6.2% |
| Interquartile 75% (IQ3) | 2.8% | 11.6% |
| Interquartile Range (IQR) | 2.2% | 5.3% |
| Standard Deviation (Sample) | 1.9% | 6.7% |
| Standard Deviation (Population) | 1.9% | 6.7% |
Correlation Details
| Estonian Percentile | Sample Size | 4 or more Vehicles in Household |
[ 0.0% - 0.5% ] 0.014% | 93,051,712 | 5.0% |
[ 0.0% - 0.5% ] 0.057% | 16,351,727 | 6.2% |
[ 0.0% - 0.5% ] 0.099% | 5,916,932 | 6.7% |
[ 0.0% - 0.5% ] 0.14% | 3,115,102 | 6.6% |
[ 0.0% - 0.5% ] 0.18% | 1,309,007 | 7.0% |
[ 0.0% - 0.5% ] 0.22% | 995,929 | 5.9% |
[ 0.0% - 0.5% ] 0.26% | 594,166 | 6.5% |
[ 0.0% - 0.5% ] 0.30% | 424,952 | 6.3% |
[ 0.0% - 0.5% ] 0.35% | 134,427 | 7.4% |
[ 0.0% - 0.5% ] 0.39% | 284,971 | 8.2% |
[ 0.0% - 0.5% ] 0.43% | 154,819 | 6.9% |
[ 0.0% - 0.5% ] 0.46% | 162,690 | 6.8% |
[ 0.5% - 1.0% ] 0.51% | 93,892 | 5.7% |
[ 0.5% - 1.0% ] 0.54% | 102,832 | 8.4% |
[ 0.5% - 1.0% ] 0.59% | 51,969 | 10.8% |
[ 0.5% - 1.0% ] 0.63% | 60,767 | 5.7% |
[ 0.5% - 1.0% ] 0.66% | 56,901 | 6.6% |
[ 0.5% - 1.0% ] 0.72% | 16,922 | 9.3% |
[ 0.5% - 1.0% ] 0.76% | 19,357 | 7.5% |
[ 0.5% - 1.0% ] 0.79% | 22,279 | 8.5% |
[ 0.5% - 1.0% ] 0.83% | 5,406 | 8.9% |
[ 0.5% - 1.0% ] 0.86% | 74,925 | 5.4% |
[ 0.5% - 1.0% ] 0.90% | 16,440 | 9.2% |
[ 0.5% - 1.0% ] 0.95% | 16,636 | 7.1% |
[ 0.5% - 1.0% ] 0.98% | 4,913 | 9.7% |
[ 1.0% - 1.5% ] 1.03% | 1,364 | 19.4% |
[ 1.0% - 1.5% ] 1.11% | 22,519 | 7.9% |
[ 1.0% - 1.5% ] 1.16% | 8,012 | 7.4% |
[ 1.0% - 1.5% ] 1.18% | 5,067 | 2.3% |
[ 1.0% - 1.5% ] 1.30% | 2,842 | 6.1% |
[ 1.0% - 1.5% ] 1.35% | 10,131 | 14.7% |
[ 1.0% - 1.5% ] 1.40% | 5,730 | 10.0% |
[ 1.0% - 1.5% ] 1.46% | 1,304 | 2.9% |
[ 1.0% - 1.5% ] 1.49% | 4,371 | 11.8% |
[ 1.5% - 2.0% ] 1.51% | 3,500 | 7.3% |
[ 1.5% - 2.0% ] 1.61% | 13,080 | 7.5% |
[ 1.5% - 2.0% ] 1.82% | 8,851 | 12.8% |
[ 1.5% - 2.0% ] 1.94% | 1,493 | 21.7% |
[ 1.5% - 2.0% ] 1.95% | 7,417 | 10.6% |
[ 1.5% - 2.0% ] 1.99% | 8,430 | 10.4% |
[ 2.0% - 2.5% ] 2.05% | 15,599 | 4.1% |
[ 2.0% - 2.5% ] 2.13% | 564 | 3.9% |
[ 2.0% - 2.5% ] 2.24% | 1,294 | 26.3% |
[ 2.0% - 2.5% ] 2.33% | 472 | 5.4% |
[ 2.0% - 2.5% ] 2.40% | 874 | 6.4% |
[ 2.5% - 3.0% ] 2.54% | 3,822 | 2.6% |
[ 2.5% - 3.0% ] 2.56% | 3,043 | 4.2% |
[ 2.5% - 3.0% ] 2.62% | 1,145 | 4.8% |
[ 2.5% - 3.0% ] 2.82% | 3,441 | 1.7% |
[ 2.5% - 3.0% ] 2.86% | 1,362 | 10.5% |
[ 3.0% - 3.5% ] 3.04% | 1,544 | 21.3% |
[ 3.0% - 3.5% ] 3.25% | 154 | 26.7% |
[ 3.0% - 3.5% ] 3.35% | 418 | 7.5% |
[ 3.5% - 4.0% ] 3.59% | 2,286 | 16.4% |
[ 3.5% - 4.0% ] 3.94% | 1,067 | 9.3% |
[ 4.0% - 4.5% ] 4.08% | 1,567 | 13.8% |
[ 4.0% - 4.5% ] 4.23% | 213 | 11.5% |
[ 4.5% - 5.0% ] 4.79% | 355 | 23.1% |
[ 5.0% - 5.5% ] 5.21% | 595 | 10.7% |
[ 5.5% - 6.0% ] 5.57% | 754 | 30.0% |
[ 5.5% - 6.0% ] 5.66% | 1,838 | 12.3% |
[ 5.5% - 6.0% ] 5.74% | 244 | 35.1% |
[ 6.0% - 6.5% ] 6.47% | 1,113 | 9.1% |
[ 7.5% - 8.0% ] 7.60% | 171 | 13.8% |
[ 7.5% - 8.0% ] 7.84% | 370 | 11.6% |