Immigrants from Sierra Leone 4 or more Vehicles in Household
COMPARE
Immigrants from Sierra Leone
Select to Compare
4 or more Vehicles in Household
Immigrants from Sierra Leone 4 or more Vehicles in Household
6.1%
4+ VEHICLES AVAILABLE
20.5/ 100
METRIC RATING
203rd/ 347
METRIC RANK
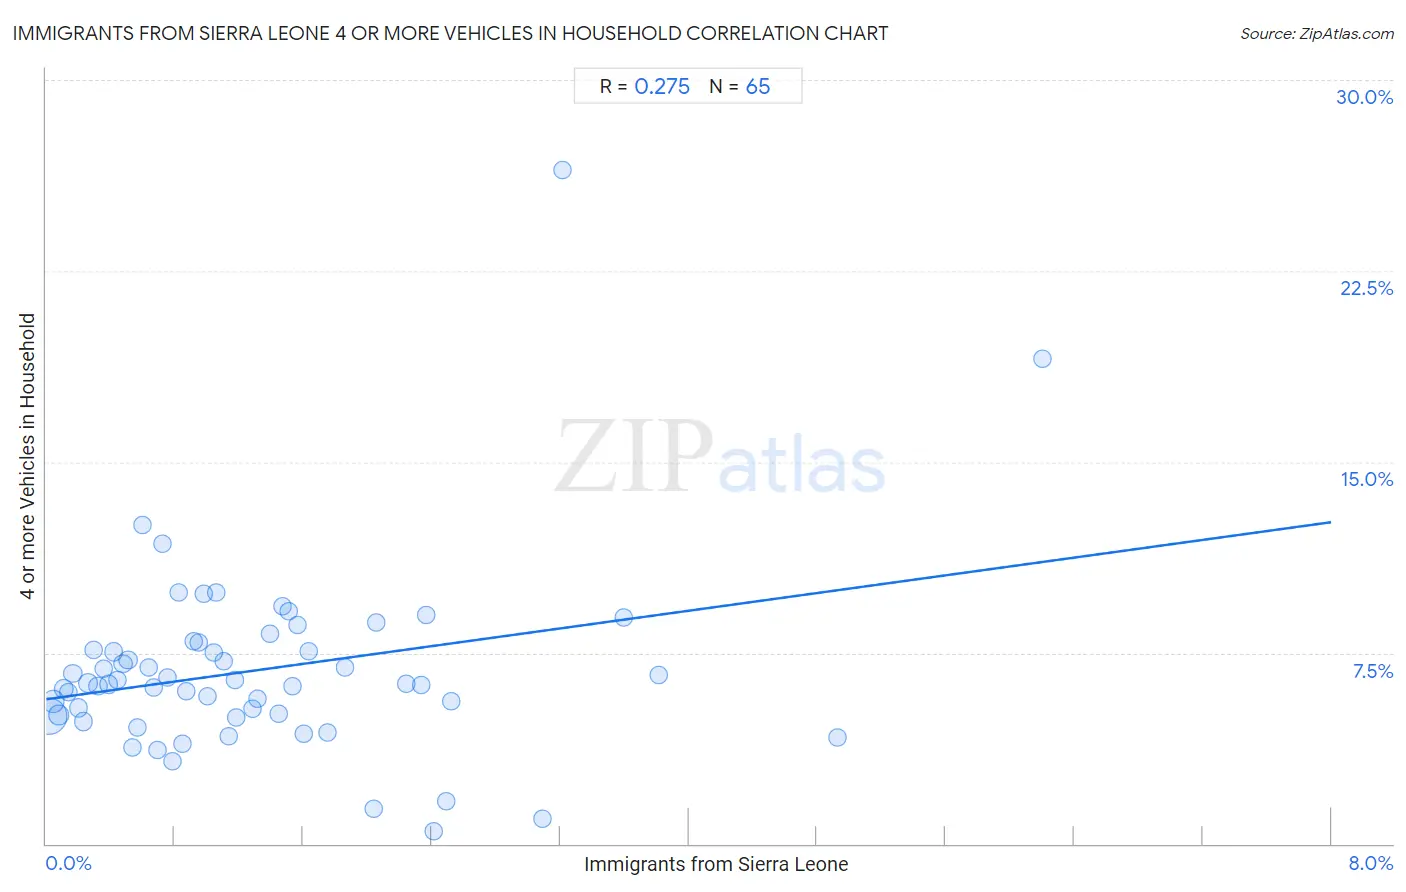
Immigrants from Sierra Leone 4 or more Vehicles in Household Correlation Chart
The statistical analysis conducted on geographies consisting of 101,342,659 people shows a weak positive correlation between the proportion of Immigrants from Sierra Leone and percentage of households with 4 or more vehicles available in the United States with a correlation coefficient (R) of 0.275 and weighted average of 6.1%. On average, for every 1% (one percent) increase in Immigrants from Sierra Leone within a typical geography, there is an increase of 0.87% in percentage of households with 4 or more vehicles available.
It is essential to understand that the correlation between the percentage of Immigrants from Sierra Leone and percentage of households with 4 or more vehicles available does not imply a direct cause-and-effect relationship. It remains uncertain whether the presence of Immigrants from Sierra Leone influences an upward or downward trend in the level of percentage of households with 4 or more vehicles available within an area, or if Immigrants from Sierra Leone simply ended up residing in those areas with higher or lower levels of percentage of households with 4 or more vehicles available due to other factors.
Demographics Similar to Immigrants from Sierra Leone by 4 or more Vehicles in Household
In terms of 4 or more vehicles in household, the demographic groups most similar to Immigrants from Sierra Leone are Immigrants from Belize (6.1%, a difference of 0.10%), Immigrants from South Central Asia (6.1%, a difference of 0.14%), Egyptian (6.1%, a difference of 0.15%), Honduran (6.1%, a difference of 0.19%), and Immigrants from Norway (6.1%, a difference of 0.20%).
| Demographics | Rating | Rank | 4 or more Vehicles in Household |
| Tsimshian | 26.4 /100 | #196 | Fair 6.2% |
| Immigrants from Sri Lanka | 23.7 /100 | #197 | Fair 6.1% |
| Immigrants from Portugal | 22.3 /100 | #198 | Fair 6.1% |
| Immigrants from Norway | 21.8 /100 | #199 | Fair 6.1% |
| Latvians | 21.7 /100 | #200 | Fair 6.1% |
| Egyptians | 21.4 /100 | #201 | Fair 6.1% |
| Immigrants from South Central Asia | 21.3 /100 | #202 | Fair 6.1% |
| Immigrants from Sierra Leone | 20.5 /100 | #203 | Fair 6.1% |
| Immigrants from Belize | 19.8 /100 | #204 | Poor 6.1% |
| Hondurans | 19.3 /100 | #205 | Poor 6.1% |
| Kenyans | 18.5 /100 | #206 | Poor 6.1% |
| Immigrants from Chile | 16.9 /100 | #207 | Poor 6.1% |
| Immigrants from Nigeria | 15.6 /100 | #208 | Poor 6.1% |
| Immigrants from Honduras | 15.4 /100 | #209 | Poor 6.1% |
| Immigrants from Zimbabwe | 15.1 /100 | #210 | Poor 6.0% |
Immigrants from Sierra Leone 4 or more Vehicles in Household Correlation Summary
| Measurement | Immigrants from Sierra Leone Data | 4 or more Vehicles in Household Data |
| Minimum | 0.014% | 0.48% |
| Maximum | 6.2% | 26.5% |
| Range | 6.2% | 26.0% |
| Mean | 1.3% | 6.8% |
| Median | 1.0% | 6.3% |
| Interquartile 25% (IQ1) | 0.49% | 5.0% |
| Interquartile 75% (IQ3) | 1.7% | 7.8% |
| Interquartile Range (IQR) | 1.2% | 2.7% |
| Standard Deviation (Sample) | 1.2% | 3.7% |
| Standard Deviation (Population) | 1.2% | 3.7% |
Correlation Details
| Immigrants from Sierra Leone Percentile | Sample Size | 4 or more Vehicles in Household |
[ 0.0% - 0.5% ] 0.014% | 59,250,161 | 5.0% |
[ 0.0% - 0.5% ] 0.044% | 14,637,289 | 5.6% |
[ 0.0% - 0.5% ] 0.077% | 7,846,718 | 5.1% |
[ 0.0% - 0.5% ] 0.11% | 3,800,812 | 6.1% |
[ 0.0% - 0.5% ] 0.14% | 2,447,534 | 5.9% |
[ 0.0% - 0.5% ] 0.17% | 1,937,557 | 6.7% |
[ 0.0% - 0.5% ] 0.20% | 1,614,728 | 5.3% |
[ 0.0% - 0.5% ] 0.23% | 2,108,030 | 4.8% |
[ 0.0% - 0.5% ] 0.26% | 515,501 | 6.3% |
[ 0.0% - 0.5% ] 0.29% | 596,988 | 7.6% |
[ 0.0% - 0.5% ] 0.32% | 978,905 | 6.2% |
[ 0.0% - 0.5% ] 0.36% | 417,881 | 6.9% |
[ 0.0% - 0.5% ] 0.39% | 403,243 | 6.3% |
[ 0.0% - 0.5% ] 0.42% | 330,557 | 7.5% |
[ 0.0% - 0.5% ] 0.45% | 425,192 | 6.5% |
[ 0.0% - 0.5% ] 0.48% | 500,099 | 7.1% |
[ 0.5% - 1.0% ] 0.51% | 316,254 | 7.2% |
[ 0.5% - 1.0% ] 0.54% | 355,837 | 3.8% |
[ 0.5% - 1.0% ] 0.57% | 309,343 | 4.6% |
[ 0.5% - 1.0% ] 0.60% | 55,303 | 12.5% |
[ 0.5% - 1.0% ] 0.64% | 206,121 | 6.9% |
[ 0.5% - 1.0% ] 0.67% | 97,497 | 6.1% |
[ 0.5% - 1.0% ] 0.70% | 116,177 | 3.7% |
[ 0.5% - 1.0% ] 0.72% | 167,473 | 11.8% |
[ 0.5% - 1.0% ] 0.76% | 96,991 | 6.5% |
[ 0.5% - 1.0% ] 0.79% | 101,150 | 3.2% |
[ 0.5% - 1.0% ] 0.82% | 312,285 | 9.9% |
[ 0.5% - 1.0% ] 0.85% | 120,186 | 3.9% |
[ 0.5% - 1.0% ] 0.87% | 117,687 | 6.0% |
[ 0.5% - 1.0% ] 0.92% | 58,787 | 8.0% |
[ 0.5% - 1.0% ] 0.95% | 130,738 | 7.9% |
[ 0.5% - 1.0% ] 0.98% | 7,129 | 9.8% |
[ 1.0% - 1.5% ] 1.00% | 85,494 | 5.8% |
[ 1.0% - 1.5% ] 1.05% | 35,552 | 7.5% |
[ 1.0% - 1.5% ] 1.06% | 11,455 | 9.9% |
[ 1.0% - 1.5% ] 1.11% | 137,976 | 7.2% |
[ 1.0% - 1.5% ] 1.14% | 27,761 | 4.2% |
[ 1.0% - 1.5% ] 1.17% | 39,527 | 6.4% |
[ 1.0% - 1.5% ] 1.18% | 98,008 | 4.9% |
[ 1.0% - 1.5% ] 1.28% | 24,430 | 5.3% |
[ 1.0% - 1.5% ] 1.31% | 32,842 | 5.7% |
[ 1.0% - 1.5% ] 1.39% | 20,794 | 8.3% |
[ 1.0% - 1.5% ] 1.45% | 26,573 | 5.1% |
[ 1.0% - 1.5% ] 1.47% | 3,052 | 9.3% |
[ 1.5% - 2.0% ] 1.51% | 20,031 | 9.1% |
[ 1.5% - 2.0% ] 1.53% | 33,855 | 6.2% |
[ 1.5% - 2.0% ] 1.56% | 44,149 | 8.6% |
[ 1.5% - 2.0% ] 1.60% | 45,799 | 4.3% |
[ 1.5% - 2.0% ] 1.63% | 4,226 | 7.6% |
[ 1.5% - 2.0% ] 1.75% | 4,683 | 4.4% |
[ 1.5% - 2.0% ] 1.86% | 6,335 | 6.9% |
[ 2.0% - 2.5% ] 2.04% | 12,017 | 1.4% |
[ 2.0% - 2.5% ] 2.06% | 37,275 | 8.7% |
[ 2.0% - 2.5% ] 2.24% | 14,901 | 6.3% |
[ 2.0% - 2.5% ] 2.33% | 19,465 | 6.2% |
[ 2.0% - 2.5% ] 2.36% | 71,682 | 9.0% |
[ 2.0% - 2.5% ] 2.41% | 9,574 | 0.48% |
[ 2.0% - 2.5% ] 2.49% | 40,201 | 1.7% |
[ 2.5% - 3.0% ] 2.52% | 2,219 | 5.6% |
[ 3.0% - 3.5% ] 3.09% | 19,531 | 0.99% |
[ 3.0% - 3.5% ] 3.21% | 1,277 | 26.5% |
[ 3.5% - 4.0% ] 3.59% | 19,369 | 8.9% |
[ 3.5% - 4.0% ] 3.82% | 5,976 | 6.6% |
[ 4.5% - 5.0% ] 4.93% | 1,481 | 4.2% |
[ 6.0% - 6.5% ] 6.20% | 4,996 | 19.1% |