Immigrants from Nicaragua 4 or more Vehicles in Household
COMPARE
Immigrants from Nicaragua
Select to Compare
4 or more Vehicles in Household
Immigrants from Nicaragua 4 or more Vehicles in Household
6.8%
4+ VEHICLES AVAILABLE
94.7/ 100
METRIC RATING
122nd/ 347
METRIC RANK
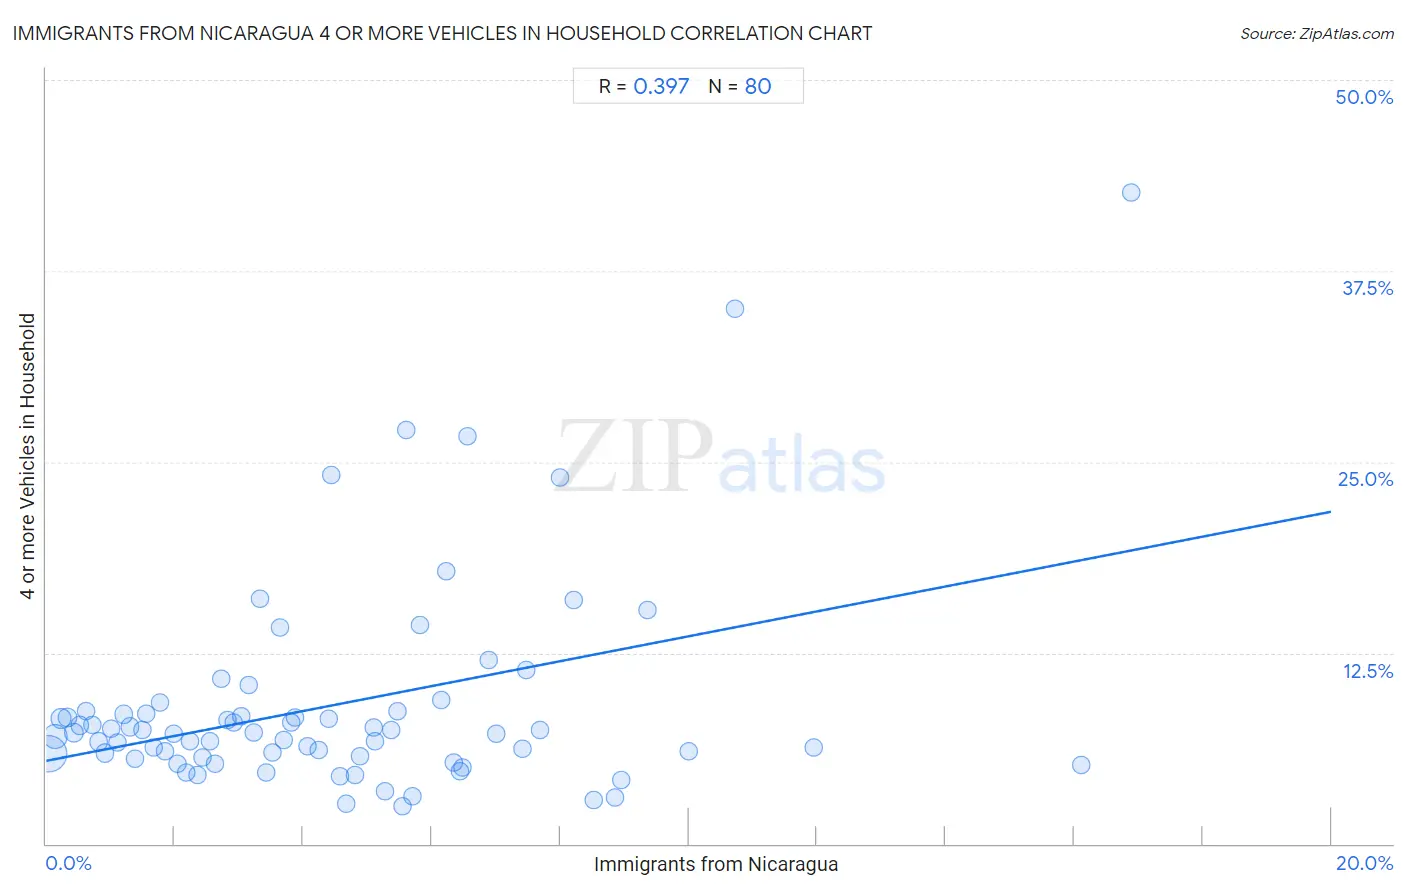
Immigrants from Nicaragua 4 or more Vehicles in Household Correlation Chart
The statistical analysis conducted on geographies consisting of 235,613,806 people shows a mild positive correlation between the proportion of Immigrants from Nicaragua and percentage of households with 4 or more vehicles available in the United States with a correlation coefficient (R) of 0.397 and weighted average of 6.8%. On average, for every 1% (one percent) increase in Immigrants from Nicaragua within a typical geography, there is an increase of 0.82% in percentage of households with 4 or more vehicles available.
It is essential to understand that the correlation between the percentage of Immigrants from Nicaragua and percentage of households with 4 or more vehicles available does not imply a direct cause-and-effect relationship. It remains uncertain whether the presence of Immigrants from Nicaragua influences an upward or downward trend in the level of percentage of households with 4 or more vehicles available within an area, or if Immigrants from Nicaragua simply ended up residing in those areas with higher or lower levels of percentage of households with 4 or more vehicles available due to other factors.
Demographics Similar to Immigrants from Nicaragua by 4 or more Vehicles in Household
In terms of 4 or more vehicles in household, the demographic groups most similar to Immigrants from Nicaragua are Immigrants from Germany (6.8%, a difference of 0.0%), Comanche (6.8%, a difference of 0.060%), Immigrants (6.8%, a difference of 0.060%), Immigrants from Asia (6.8%, a difference of 0.16%), and Austrian (6.8%, a difference of 0.26%).
| Demographics | Rating | Rank | 4 or more Vehicles in Household |
| Tlingit-Haida | 96.2 /100 | #115 | Exceptional 6.8% |
| Immigrants from Guatemala | 95.8 /100 | #116 | Exceptional 6.8% |
| Burmese | 95.7 /100 | #117 | Exceptional 6.8% |
| French American Indians | 95.7 /100 | #118 | Exceptional 6.8% |
| Costa Ricans | 95.5 /100 | #119 | Exceptional 6.8% |
| Comanche | 94.8 /100 | #120 | Exceptional 6.8% |
| Immigrants from Germany | 94.7 /100 | #121 | Exceptional 6.8% |
| Immigrants from Nicaragua | 94.7 /100 | #122 | Exceptional 6.8% |
| Immigrants | 94.6 /100 | #123 | Exceptional 6.8% |
| Immigrants from Asia | 94.4 /100 | #124 | Exceptional 6.8% |
| Austrians | 94.1 /100 | #125 | Exceptional 6.8% |
| Belgians | 94.1 /100 | #126 | Exceptional 6.8% |
| Immigrants from Korea | 93.8 /100 | #127 | Exceptional 6.8% |
| Immigrants from Bolivia | 92.5 /100 | #128 | Exceptional 6.7% |
| Immigrants from England | 92.0 /100 | #129 | Exceptional 6.7% |
Immigrants from Nicaragua 4 or more Vehicles in Household Correlation Summary
| Measurement | Immigrants from Nicaragua Data | 4 or more Vehicles in Household Data |
| Minimum | 0.043% | 2.4% |
| Maximum | 16.9% | 42.6% |
| Range | 16.8% | 40.2% |
| Mean | 4.5% | 9.1% |
| Median | 3.8% | 7.2% |
| Interquartile 25% (IQ1) | 1.9% | 5.7% |
| Interquartile 75% (IQ3) | 6.3% | 8.6% |
| Interquartile Range (IQR) | 4.4% | 2.9% |
| Standard Deviation (Sample) | 3.4% | 7.0% |
| Standard Deviation (Population) | 3.4% | 6.9% |
Correlation Details
| Immigrants from Nicaragua Percentile | Sample Size | 4 or more Vehicles in Household |
[ 0.0% - 0.5% ] 0.043% | 137,703,980 | 5.9% |
[ 0.0% - 0.5% ] 0.14% | 42,409,511 | 7.0% |
[ 0.0% - 0.5% ] 0.23% | 21,762,703 | 8.2% |
[ 0.0% - 0.5% ] 0.33% | 9,247,479 | 8.2% |
[ 0.0% - 0.5% ] 0.43% | 6,563,063 | 7.2% |
[ 0.5% - 1.0% ] 0.52% | 3,448,581 | 7.7% |
[ 0.5% - 1.0% ] 0.62% | 2,788,859 | 8.7% |
[ 0.5% - 1.0% ] 0.72% | 1,648,353 | 7.8% |
[ 0.5% - 1.0% ] 0.81% | 1,762,520 | 6.7% |
[ 0.5% - 1.0% ] 0.91% | 969,055 | 5.9% |
[ 1.0% - 1.5% ] 1.01% | 680,913 | 7.5% |
[ 1.0% - 1.5% ] 1.12% | 611,167 | 6.6% |
[ 1.0% - 1.5% ] 1.21% | 501,792 | 8.5% |
[ 1.0% - 1.5% ] 1.30% | 497,947 | 7.7% |
[ 1.0% - 1.5% ] 1.38% | 291,781 | 5.5% |
[ 1.0% - 1.5% ] 1.50% | 463,298 | 7.4% |
[ 1.5% - 2.0% ] 1.56% | 247,045 | 8.5% |
[ 1.5% - 2.0% ] 1.68% | 301,659 | 6.3% |
[ 1.5% - 2.0% ] 1.77% | 39,282 | 9.3% |
[ 1.5% - 2.0% ] 1.85% | 215,724 | 6.1% |
[ 1.5% - 2.0% ] 1.98% | 60,301 | 7.2% |
[ 2.0% - 2.5% ] 2.05% | 267,160 | 5.3% |
[ 2.0% - 2.5% ] 2.17% | 29,198 | 4.7% |
[ 2.0% - 2.5% ] 2.23% | 59,190 | 6.7% |
[ 2.0% - 2.5% ] 2.35% | 44,312 | 4.5% |
[ 2.0% - 2.5% ] 2.42% | 248,977 | 5.7% |
[ 2.5% - 3.0% ] 2.55% | 173,321 | 6.7% |
[ 2.5% - 3.0% ] 2.62% | 67,641 | 5.2% |
[ 2.5% - 3.0% ] 2.72% | 55,241 | 10.8% |
[ 2.5% - 3.0% ] 2.82% | 23,394 | 8.1% |
[ 2.5% - 3.0% ] 2.92% | 104,866 | 7.9% |
[ 3.0% - 3.5% ] 3.03% | 141,302 | 8.3% |
[ 3.0% - 3.5% ] 3.16% | 133,929 | 10.4% |
[ 3.0% - 3.5% ] 3.23% | 118,950 | 7.3% |
[ 3.0% - 3.5% ] 3.33% | 21,213 | 16.0% |
[ 3.0% - 3.5% ] 3.43% | 176,909 | 4.7% |
[ 3.5% - 4.0% ] 3.52% | 226,831 | 6.0% |
[ 3.5% - 4.0% ] 3.64% | 4,098 | 14.2% |
[ 3.5% - 4.0% ] 3.69% | 96,536 | 6.8% |
[ 3.5% - 4.0% ] 3.81% | 4,987 | 8.0% |
[ 3.5% - 4.0% ] 3.87% | 80,755 | 8.3% |
[ 4.0% - 4.5% ] 4.06% | 60,592 | 6.3% |
[ 4.0% - 4.5% ] 4.24% | 50,106 | 6.1% |
[ 4.0% - 4.5% ] 4.40% | 44,062 | 8.2% |
[ 4.0% - 4.5% ] 4.44% | 496 | 24.1% |
[ 4.5% - 5.0% ] 4.58% | 63,650 | 4.4% |
[ 4.5% - 5.0% ] 4.67% | 444,748 | 2.6% |
[ 4.5% - 5.0% ] 4.80% | 49,347 | 4.5% |
[ 4.5% - 5.0% ] 4.88% | 105,852 | 5.7% |
[ 5.0% - 5.5% ] 5.09% | 47,065 | 7.6% |
[ 5.0% - 5.5% ] 5.11% | 30,980 | 6.7% |
[ 5.0% - 5.5% ] 5.28% | 45,620 | 3.4% |
[ 5.0% - 5.5% ] 5.36% | 1,604 | 7.5% |
[ 5.0% - 5.5% ] 5.47% | 822 | 8.7% |
[ 5.5% - 6.0% ] 5.54% | 85,736 | 2.4% |
[ 5.5% - 6.0% ] 5.59% | 143 | 27.1% |
[ 5.5% - 6.0% ] 5.69% | 14,698 | 3.1% |
[ 5.5% - 6.0% ] 5.83% | 309 | 14.3% |
[ 6.0% - 6.5% ] 6.14% | 5,049 | 9.4% |
[ 6.0% - 6.5% ] 6.22% | 16,776 | 17.8% |
[ 6.0% - 6.5% ] 6.34% | 867 | 5.3% |
[ 6.0% - 6.5% ] 6.44% | 34,335 | 4.8% |
[ 6.0% - 6.5% ] 6.47% | 59,121 | 5.0% |
[ 6.5% - 7.0% ] 6.56% | 457 | 26.7% |
[ 6.5% - 7.0% ] 6.89% | 740 | 12.0% |
[ 6.5% - 7.0% ] 7.00% | 443 | 7.2% |
[ 7.0% - 7.5% ] 7.41% | 297 | 6.2% |
[ 7.0% - 7.5% ] 7.46% | 469 | 11.4% |
[ 7.5% - 8.0% ] 7.69% | 390 | 7.5% |
[ 8.0% - 8.5% ] 8.00% | 475 | 24.0% |
[ 8.0% - 8.5% ] 8.21% | 1,194 | 15.9% |
[ 8.5% - 9.0% ] 8.53% | 40,278 | 2.9% |
[ 8.5% - 9.0% ] 8.86% | 34,742 | 3.0% |
[ 8.5% - 9.0% ] 8.96% | 54,873 | 4.2% |
[ 9.0% - 9.5% ] 9.36% | 844 | 15.3% |
[ 9.5% - 10.0% ] 10.00% | 2,041 | 6.1% |
[ 10.5% - 11.0% ] 10.73% | 289 | 35.1% |
[ 11.5% - 12.0% ] 11.95% | 778 | 6.3% |
[ 16.0% - 16.5% ] 16.11% | 19,399 | 5.2% |
[ 16.5% - 17.0% ] 16.89% | 296 | 42.6% |