Immigrants from Saudi Arabia 4 or more Vehicles in Household

COMPARE

Immigrants from Saudi Arabia
Race
Ancestry
AfghanAfricanAlaska NativeAlaskan AthabascanAlbanianAleutAlsatianAmericanApacheArabArapahoArgentineanArmenianAssyrian/Chaldean/SyriacAustralianAustrianBahamianBangladeshiBarbadianBasqueBelgianBelizeanBermudanBhutaneseBlackfeetBolivianBrazilianBritishBritish West IndianBulgarianBurmeseCajunCambodianCanadianCape VerdeanCarpatho RusynCelticCentral AmericanCentral American IndianCherokeeCheyenneChickasawChileanChineseChippewaChoctawColombianColvilleComancheCosta RicanCreeCreekCroatianCrowCubanCypriotCzechCzechoslovakianDanishDelawareDominicanDutchDutch West IndianEastern EuropeanEcuadorianEgyptianEnglishEstonianEthiopianEuropeanFijianFilipinoFinnishFrenchFrench American IndianFrench CanadianGermanGerman RussianGhanaianGreekGuamanian/ChamorroGuatemalanGuyaneseHaitianHmongHonduranHopiHoumaHungarianIcelanderIndian (Asian)IndonesianInupiatIranianIraqiIrishIroquoisIsraeliItalianJamaicanJapaneseJordanianKenyanKiowaKoreanLaotianLatvianLebaneseLiberianLithuanianLumbeeLuxembourgerMacedonianMalaysianMalteseMarshalleseMenomineeMexicanMexican American IndianMongolianMoroccanNative HawaiianNavajoNepaleseNew ZealanderNicaraguanNigerianNorthern EuropeanNorwegianOkinawanOsageOttawaPaiutePakistaniPalestinianPanamanianParaguayanPennsylvania GermanPeruvianPimaPolishPortuguesePotawatomiPuebloPuerto RicanPuget Sound SalishRomanianRussianSalvadoranSamoanScandinavianScotch-IrishScottishSeminoleSenegaleseSerbianShoshoneSierra LeoneanSiouxSlavicSlovakSloveneSomaliSouth AfricanSouth AmericanSouth American IndianSoviet UnionSpaniardSpanishSpanish AmericanSpanish American IndianSri LankanSubsaharan AfricanSudaneseSwedishSwissSyrianTaiwaneseThaiTlingit-HaidaTohono O'OdhamTonganTrinidadian and TobagonianTsimshianTurkishU.S. Virgin IslanderUgandanUkrainianUruguayanUteVenezuelanVietnameseWelshWest IndianYakamaYaquiYugoslavianYumanYup'ikZimbabwean
Immigration
NonimmigrantsImmigrantsAfghanistanAfricaAlbaniaArgentinaArmeniaAsiaAustraliaAustriaBahamasBangladeshBarbadosBelarusBelgiumBelizeBoliviaBosnia and HerzegovinaBrazilBulgariaBurma/MyanmarCabo VerdeCambodiaCameroonCanadaCaribbeanCentral AmericaChileChinaColombiaCongoCosta RicaCroatiaCubaCzechoslovakiaDenmarkDominicaDominican RepublicEastern AfricaEastern AsiaEastern EuropeEcuadorEgyptEl SalvadorEnglandEritreaEthiopiaEuropeFijiFranceGermanyGhanaGreeceGrenadaGuatemalaGuyanaHaitiHondurasHong KongHungaryIndiaIndonesiaIranIraqIrelandIsraelItalyJamaicaJapanJordanKazakhstanKenyaKoreaKuwaitLaosLatin AmericaLatviaLebanonLiberiaLithuaniaMalaysiaMexicoMicronesiaMiddle AfricaMoldovaMoroccoNepalNetherlandsNicaraguaNigeriaNorth AmericaNorth MacedoniaNorthern AfricaNorthern EuropeNorwayOceaniaPakistanPanamaPeruPhilippinesPolandPortugalRomaniaRussiaSaudi ArabiaScotlandSenegalSerbiaSierra LeoneSingaporeSomaliaSouth AfricaSouth AmericaSouth Central AsiaSouth Eastern AsiaSouthern EuropeSpainSri LankaSt. Vincent and the GrenadinesSudanSwedenSwitzerlandSyriaTaiwanThailandTrinidad and TobagoTurkeyUgandaUkraineUruguayUzbekistanVenezuelaVietnamWest IndiesWestern AfricaWestern AsiaWestern EuropeYemenZaireZimbabweAzores
Select to Compare
Race
Ancestry
AfghanAfricanAlaska NativeAlaskan AthabascanAlbanianAleutAlsatianAmericanApacheArabArapahoArgentineanArmenianAssyrian/Chaldean/SyriacAustralianAustrianBahamianBangladeshiBarbadianBasqueBelgianBelizeanBermudanBhutaneseBlackfeetBolivianBrazilianBritishBritish West IndianBulgarianBurmeseCajunCambodianCanadianCape VerdeanCarpatho RusynCelticCentral AmericanCentral American IndianCherokeeCheyenneChickasawChileanChineseChippewaChoctawColombianColvilleComancheCosta RicanCreeCreekCroatianCrowCubanCypriotCzechCzechoslovakianDanishDelawareDominicanDutchDutch West IndianEastern EuropeanEcuadorianEgyptianEnglishEstonianEthiopianEuropeanFijianFilipinoFinnishFrenchFrench American IndianFrench CanadianGermanGerman RussianGhanaianGreekGuamanian/ChamorroGuatemalanGuyaneseHaitianHmongHonduranHopiHoumaHungarianIcelanderIndian (Asian)IndonesianInupiatIranianIraqiIrishIroquoisIsraeliItalianJamaicanJapaneseJordanianKenyanKiowaKoreanLaotianLatvianLebaneseLiberianLithuanianLumbeeLuxembourgerMacedonianMalaysianMalteseMarshalleseMenomineeMexicanMexican American IndianMongolianMoroccanNative HawaiianNavajoNepaleseNew ZealanderNicaraguanNigerianNorthern EuropeanNorwegianOkinawanOsageOttawaPaiutePakistaniPalestinianPanamanianParaguayanPennsylvania GermanPeruvianPimaPolishPortuguesePotawatomiPuebloPuerto RicanPuget Sound SalishRomanianRussianSalvadoranSamoanScandinavianScotch-IrishScottishSeminoleSenegaleseSerbianShoshoneSierra LeoneanSiouxSlavicSlovakSloveneSomaliSouth AfricanSouth AmericanSouth American IndianSoviet UnionSpaniardSpanishSpanish AmericanSpanish American IndianSri LankanSubsaharan AfricanSudaneseSwedishSwissSyrianTaiwaneseThaiTlingit-HaidaTohono O'OdhamTonganTrinidadian and TobagonianTsimshianTurkishU.S. Virgin IslanderUgandanUkrainianUruguayanUteVenezuelanVietnameseWelshWest IndianYakamaYaquiYugoslavianYumanYup'ikZimbabwean
Immigration
NonimmigrantsImmigrantsAfghanistanAfricaAlbaniaArgentinaArmeniaAsiaAustraliaAustriaBahamasBangladeshBarbadosBelarusBelgiumBelizeBoliviaBosnia and HerzegovinaBrazilBulgariaBurma/MyanmarCabo VerdeCambodiaCameroonCanadaCaribbeanCentral AmericaChileChinaColombiaCongoCosta RicaCroatiaCubaCzechoslovakiaDenmarkDominicaDominican RepublicEastern AfricaEastern AsiaEastern EuropeEcuadorEgyptEl SalvadorEnglandEritreaEthiopiaEuropeFijiFranceGermanyGhanaGreeceGrenadaGuatemalaGuyanaHaitiHondurasHong KongHungaryIndiaIndonesiaIranIraqIrelandIsraelItalyJamaicaJapanJordanKazakhstanKenyaKoreaKuwaitLaosLatin AmericaLatviaLebanonLiberiaLithuaniaMalaysiaMexicoMicronesiaMiddle AfricaMoldovaMoroccoNepalNetherlandsNicaraguaNigeriaNorth AmericaNorth MacedoniaNorthern AfricaNorthern EuropeNorwayOceaniaPakistanPanamaPeruPhilippinesPolandPortugalRomaniaRussiaScotlandSenegalSerbiaSierra LeoneSingaporeSomaliaSouth AfricaSouth AmericaSouth Central AsiaSouth Eastern AsiaSouthern EuropeSpainSri LankaSt. Vincent and the GrenadinesSudanSwedenSwitzerlandSyriaTaiwanThailandTrinidad and TobagoTurkeyUgandaUkraineUruguayUzbekistanVenezuelaVietnamWest IndiesWestern AfricaWestern AsiaWestern EuropeYemenZaireZimbabweAzores
4 or more Vehicles in Household
Income
Poverty
Unemployment
Labor Participation
Family Structure
Vehicle Availability
Education Level
Disability

Immigrants from Saudi Arabia 4 or more Vehicles in Household
Tragic

5.6%
4+ VEHICLES AVAILABLE
1.1/ 100
METRIC RATING
263rd/ 347
METRIC RANK

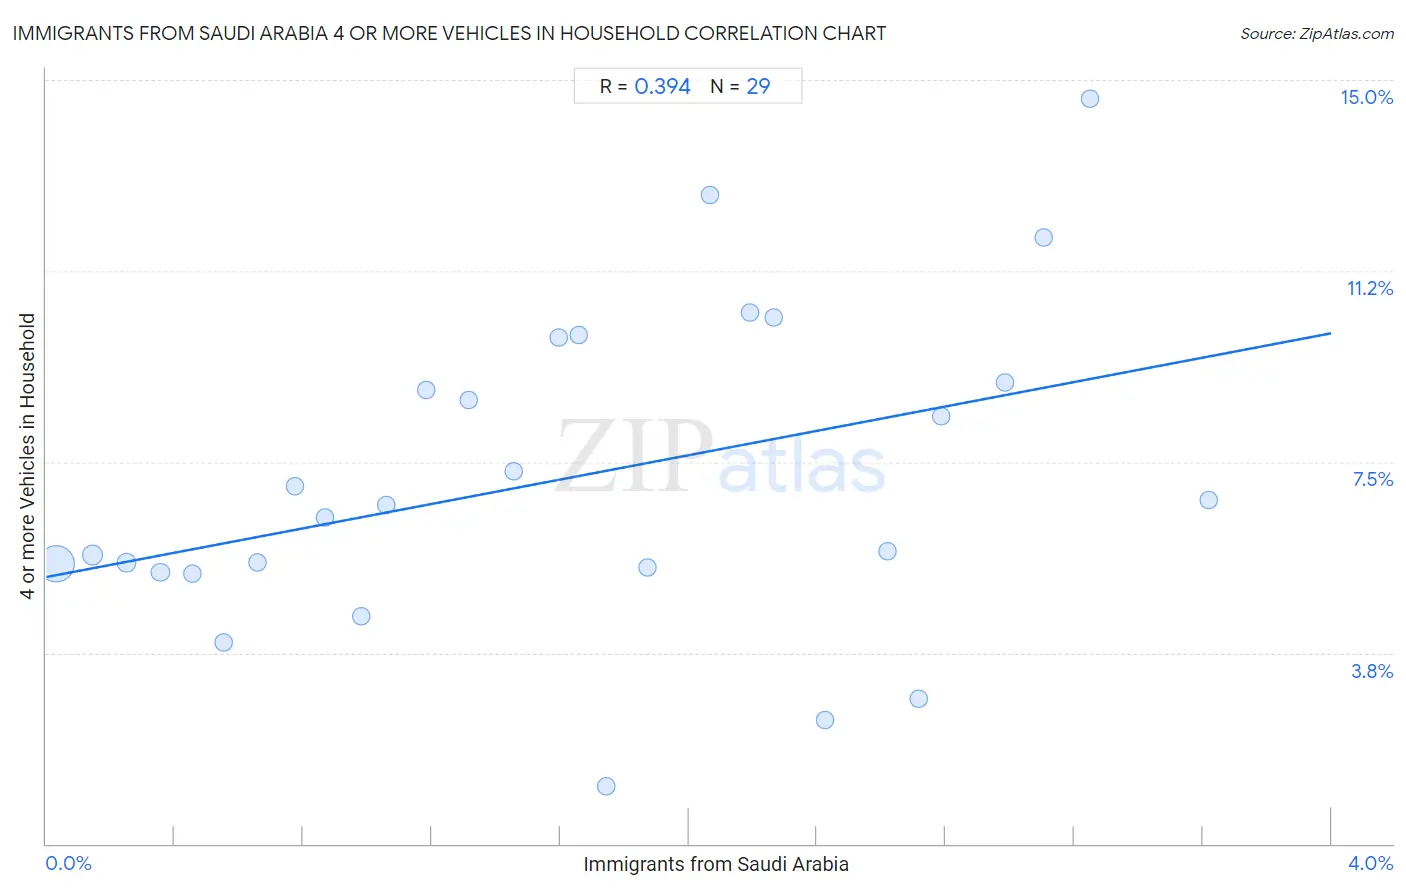
Immigrants from Saudi Arabia 4 or more Vehicles in Household Correlation Chart

The statistical analysis conducted on geographies consisting of 163,697,717 people shows a mild positive correlation between the proportion of Immigrants from Saudi Arabia and percentage of households with 4 or more vehicles available in the United States with a correlation coefficient (R) of 0.394 and weighted average of 5.6%. On average, for every 1% (one percent) increase in Immigrants from Saudi Arabia within a typical geography, there is an increase of 1.2% in percentage of households with 4 or more vehicles available.
Immigrants from Saudi Arabia 4 or more Vehicles in Household
It is essential to understand that the correlation between the percentage of Immigrants from Saudi Arabia and percentage of households with 4 or more vehicles available does not imply a direct cause-and-effect relationship. It remains uncertain whether the presence of Immigrants from Saudi Arabia influences an upward or downward trend in the level of percentage of households with 4 or more vehicles available within an area, or if Immigrants from Saudi Arabia simply ended up residing in those areas with higher or lower levels of percentage of households with 4 or more vehicles available due to other factors.

Demographics Similar to Immigrants from Saudi Arabia by 4 or more Vehicles in Household

In terms of 4 or more vehicles in household, the demographic groups most similar to Immigrants from Saudi Arabia are Bermudan (5.6%, a difference of 0.090%), Sudanese (5.6%, a difference of 0.20%), Uruguayan (5.6%, a difference of 0.29%), Immigrants from France (5.6%, a difference of 0.47%), and Immigrants from Lithuania (5.6%, a difference of 0.51%).
DemographicsRating | Rank4 or more Vehicles in Household
Immigrants from Turkey
1.5
/100
|
#256
Tragic
5.7%
Immigrants from Northern Africa
1.4
/100
|
#257
Tragic
5.6%
Immigrants from Lithuania
1.4
/100
|
#258
Tragic
5.6%
Immigrants from France
1.3
/100
|
#259
Tragic
5.6%
Uruguayans
1.3
/100
|
#260
Tragic
5.6%
Sudanese
1.2
/100
|
#261
Tragic
5.6%
Bermudans
1.2
/100
|
#262
Tragic
5.6%
Immigrants from Saudi Arabia
1.1
/100
|
#263
Tragic
5.6%
Immigrants from Africa
1.0
/100
|
#264
Tragic
5.6%
South Americans
0.9
/100
|
#265
Tragic
5.6%
Immigrants from Nepal
0.9
/100
|
#266
Tragic
5.6%
Immigrants from Ukraine
0.9
/100
|
#267
Tragic
5.6%
Colombians
0.7
/100
|
#268
Tragic
5.5%
Carpatho Rusyns
0.7
/100
|
#269
Tragic
5.5%
Okinawans
0.6
/100
|
#270
Tragic
5.5%

Immigrants from Saudi Arabia 4 or more Vehicles in Household Correlation Summary

MeasurementImmigrants from Saudi Arabia Data4 or more Vehicles in Household Data
Minimum0.033%1.1%
Maximum3.6%14.6%
Range3.6%13.5%
Mean1.6%7.2%
Median1.6%6.6%
Interquartile 25% (IQ1)0.72%5.4%
Interquartile 75% (IQ3)2.5%9.5%
Interquartile Range (IQR)1.8%4.1%
Standard Deviation (Sample)1.0%3.1%
Standard Deviation (Population)1.0%3.1%

Correlation Details

Immigrants from Saudi Arabia PercentileSample Size4 or more Vehicles in Household
[
0.0%
-
0.5%
]
0.033%
134,555,6585.5%
[
0.0%
-
0.5%
]
0.14%
17,068,0345.7%
[
0.0%
-
0.5%
]
0.25%
5,543,8485.5%
[
0.0%
-
0.5%
]
0.35%
2,762,1705.3%
[
0.0%
-
0.5%
]
0.45%
1,329,9775.3%
[
0.5%
-
1.0%
]
0.55%
611,0214.0%
[
0.5%
-
1.0%
]
0.66%
423,1255.5%
[
0.5%
-
1.0%
]
0.77%
492,1427.0%
[
0.5%
-
1.0%
]
0.87%
171,3866.4%
[
0.5%
-
1.0%
]
0.98%
225,1554.5%
[
1.0%
-
1.5%
]
1.06%
216,5236.6%
[
1.0%
-
1.5%
]
1.18%
72,3518.9%
[
1.0%
-
1.5%
]
1.31%
42,2928.7%
[
1.0%
-
1.5%
]
1.45%
23,3177.3%
[
1.5%
-
2.0%
]
1.60%
5,4509.9%
[
1.5%
-
2.0%
]
1.66%
11,87710.0%
[
1.5%
-
2.0%
]
1.74%
35,1301.1%
[
1.5%
-
2.0%
]
1.87%
17,0905.4%
[
2.0%
-
2.5%
]
2.06%
7,65412.8%
[
2.0%
-
2.5%
]
2.19%
10,58810.4%
[
2.0%
-
2.5%
]
2.27%
13,81410.3%
[
2.0%
-
2.5%
]
2.42%
9,6912.4%
[
2.5%
-
3.0%
]
2.62%
20,7345.7%
[
2.5%
-
3.0%
]
2.71%
8,6582.8%
[
2.5%
-
3.0%
]
2.79%
3,9838.4%
[
2.5%
-
3.0%
]
2.98%
8,6509.1%
[
3.0%
-
3.5%
]
3.11%
5,08811.9%
[
3.0%
-
3.5%
]
3.25%
1,78614.6%
[
3.5%
-
4.0%
]
3.62%
5256.7%