Danish 4 or more Vehicles in Household
COMPARE
Danish
Select to Compare
4 or more Vehicles in Household
Danish 4 or more Vehicles in Household
8.6%
4+ VEHICLES AVAILABLE
100.0/ 100
METRIC RATING
21st/ 347
METRIC RANK
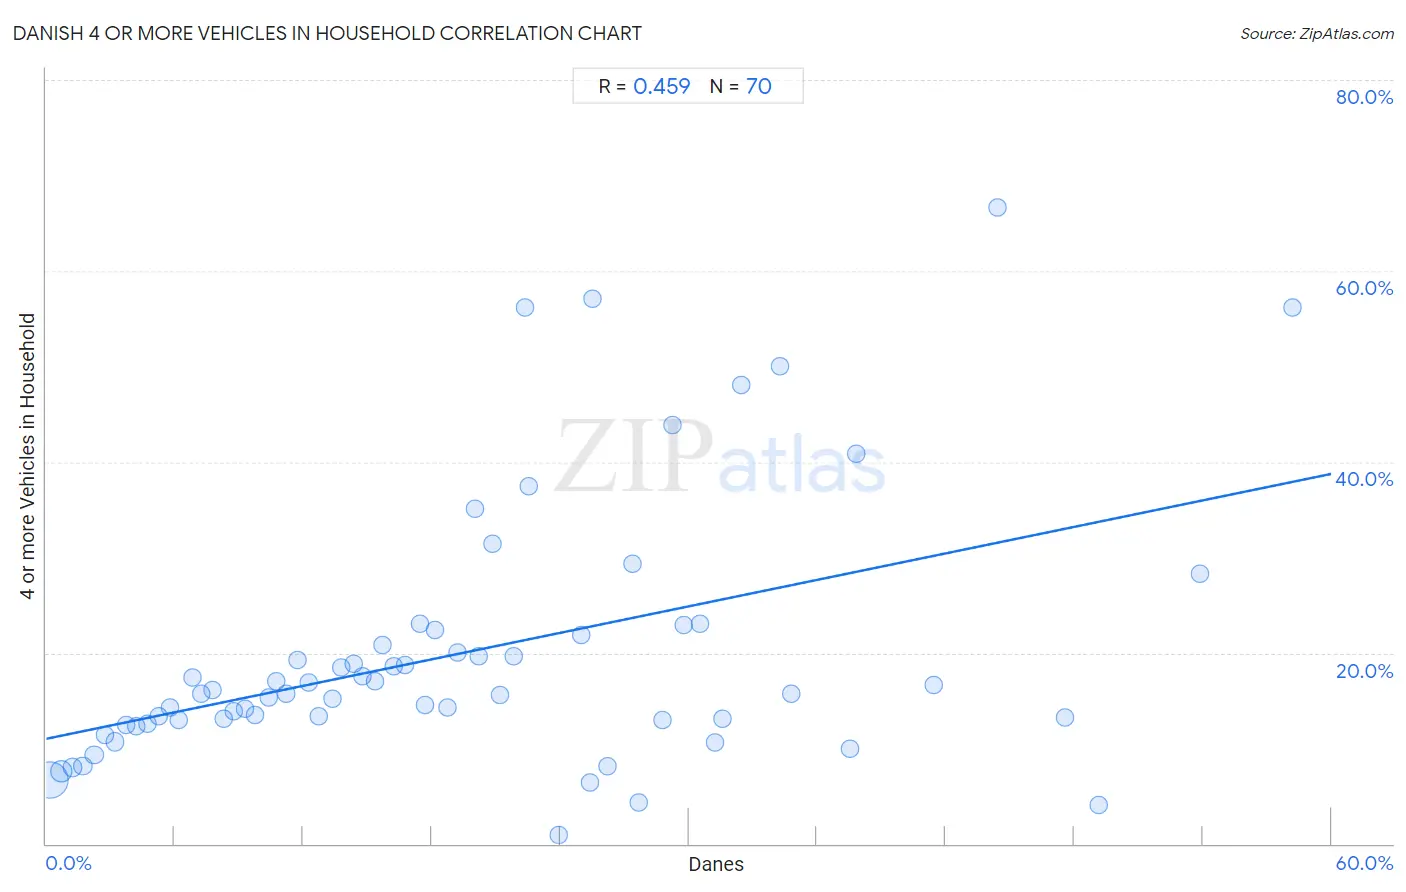
Danish 4 or more Vehicles in Household Correlation Chart
The statistical analysis conducted on geographies consisting of 472,183,254 people shows a moderate positive correlation between the proportion of Danes and percentage of households with 4 or more vehicles available in the United States with a correlation coefficient (R) of 0.459 and weighted average of 8.6%. On average, for every 1% (one percent) increase in Danes within a typical geography, there is an increase of 0.46% in percentage of households with 4 or more vehicles available.
It is essential to understand that the correlation between the percentage of Danes and percentage of households with 4 or more vehicles available does not imply a direct cause-and-effect relationship. It remains uncertain whether the presence of Danes influences an upward or downward trend in the level of percentage of households with 4 or more vehicles available within an area, or if Danes simply ended up residing in those areas with higher or lower levels of percentage of households with 4 or more vehicles available due to other factors.
Demographics Similar to Danes by 4 or more Vehicles in Household
In terms of 4 or more vehicles in household, the demographic groups most similar to Danes are Pueblo (8.6%, a difference of 0.050%), Immigrants from Vietnam (8.6%, a difference of 0.050%), Immigrants from Philippines (8.5%, a difference of 0.26%), Korean (8.6%, a difference of 0.87%), and Immigrants from Central America (8.5%, a difference of 1.1%).
| Demographics | Rating | Rank | 4 or more Vehicles in Household |
| Chinese | 100.0 /100 | #14 | Exceptional 8.8% |
| Shoshone | 100.0 /100 | #15 | Exceptional 8.8% |
| Lumbee | 100.0 /100 | #16 | Exceptional 8.8% |
| Ute | 100.0 /100 | #17 | Exceptional 8.8% |
| Nepalese | 100.0 /100 | #18 | Exceptional 8.7% |
| Koreans | 100.0 /100 | #19 | Exceptional 8.6% |
| Pueblo | 100.0 /100 | #20 | Exceptional 8.6% |
| Danes | 100.0 /100 | #21 | Exceptional 8.6% |
| Immigrants from Vietnam | 100.0 /100 | #22 | Exceptional 8.6% |
| Immigrants from Philippines | 100.0 /100 | #23 | Exceptional 8.5% |
| Immigrants from Central America | 100.0 /100 | #24 | Exceptional 8.5% |
| Basques | 100.0 /100 | #25 | Exceptional 8.4% |
| Mexican American Indians | 100.0 /100 | #26 | Exceptional 8.4% |
| Sri Lankans | 100.0 /100 | #27 | Exceptional 8.4% |
| Cheyenne | 100.0 /100 | #28 | Exceptional 8.3% |
Danish 4 or more Vehicles in Household Correlation Summary
| Measurement | Danish Data | 4 or more Vehicles in Household Data |
| Minimum | 0.19% | 0.95% |
| Maximum | 58.2% | 66.7% |
| Range | 58.0% | 65.7% |
| Mean | 19.5% | 20.0% |
| Median | 17.6% | 15.7% |
| Interquartile 25% (IQ1) | 8.8% | 12.9% |
| Interquartile 75% (IQ3) | 27.7% | 21.9% |
| Interquartile Range (IQR) | 18.9% | 9.0% |
| Standard Deviation (Sample) | 13.6% | 13.7% |
| Standard Deviation (Population) | 13.5% | 13.6% |
Correlation Details
| Danish Percentile | Sample Size | 4 or more Vehicles in Household |
[ 0.0% - 0.5% ] 0.19% | 355,713,127 | 6.6% |
[ 0.5% - 1.0% ] 0.71% | 70,002,173 | 7.6% |
[ 1.0% - 1.5% ] 1.20% | 24,520,838 | 8.0% |
[ 1.5% - 2.0% ] 1.70% | 9,004,776 | 8.2% |
[ 2.0% - 2.5% ] 2.24% | 3,199,607 | 9.4% |
[ 2.5% - 3.0% ] 2.73% | 1,997,755 | 11.4% |
[ 3.0% - 3.5% ] 3.22% | 1,484,712 | 10.7% |
[ 3.5% - 4.0% ] 3.75% | 1,682,550 | 12.4% |
[ 4.0% - 4.5% ] 4.21% | 1,162,164 | 12.3% |
[ 4.5% - 5.0% ] 4.73% | 956,240 | 12.6% |
[ 5.0% - 5.5% ] 5.27% | 778,771 | 13.3% |
[ 5.5% - 6.0% ] 5.77% | 470,086 | 14.2% |
[ 6.0% - 6.5% ] 6.18% | 259,358 | 12.9% |
[ 6.5% - 7.0% ] 6.80% | 185,926 | 17.4% |
[ 7.0% - 7.5% ] 7.22% | 133,273 | 15.7% |
[ 7.5% - 8.0% ] 7.74% | 198,800 | 16.1% |
[ 8.0% - 8.5% ] 8.28% | 105,455 | 13.1% |
[ 8.5% - 9.0% ] 8.76% | 60,167 | 13.9% |
[ 9.0% - 9.5% ] 9.26% | 22,862 | 14.1% |
[ 9.5% - 10.0% ] 9.77% | 35,889 | 13.5% |
[ 10.0% - 10.5% ] 10.40% | 16,390 | 15.3% |
[ 10.5% - 11.0% ] 10.75% | 28,390 | 17.0% |
[ 11.0% - 11.5% ] 11.22% | 23,069 | 15.7% |
[ 11.5% - 12.0% ] 11.72% | 7,617 | 19.3% |
[ 12.0% - 12.5% ] 12.23% | 4,790 | 16.9% |
[ 12.5% - 13.0% ] 12.71% | 16,217 | 13.4% |
[ 13.0% - 13.5% ] 13.35% | 16,794 | 15.2% |
[ 13.5% - 14.0% ] 13.77% | 11,014 | 18.4% |
[ 14.0% - 14.5% ] 14.37% | 11,839 | 18.9% |
[ 14.5% - 15.0% ] 14.78% | 6,301 | 17.5% |
[ 15.0% - 15.5% ] 15.32% | 3,191 | 17.0% |
[ 15.5% - 16.0% ] 15.69% | 3,269 | 20.8% |
[ 16.0% - 16.5% ] 16.20% | 1,883 | 18.6% |
[ 16.5% - 17.0% ] 16.73% | 4,979 | 18.8% |
[ 17.0% - 17.5% ] 17.44% | 9,376 | 23.1% |
[ 17.5% - 18.0% ] 17.71% | 3,337 | 14.6% |
[ 18.0% - 18.5% ] 18.17% | 2,168 | 22.4% |
[ 18.5% - 19.0% ] 18.71% | 3,004 | 14.3% |
[ 19.0% - 19.5% ] 19.21% | 4,341 | 20.1% |
[ 20.0% - 20.5% ] 20.00% | 1,005 | 35.0% |
[ 20.0% - 20.5% ] 20.19% | 5,766 | 19.6% |
[ 20.5% - 21.0% ] 20.83% | 72 | 31.4% |
[ 21.0% - 21.5% ] 21.19% | 2,869 | 15.6% |
[ 21.5% - 22.0% ] 21.80% | 4,844 | 19.7% |
[ 22.0% - 22.5% ] 22.37% | 152 | 56.2% |
[ 22.5% - 23.0% ] 22.52% | 222 | 37.5% |
[ 23.5% - 24.0% ] 23.90% | 364 | 0.95% |
[ 25.0% - 25.5% ] 25.00% | 284 | 21.9% |
[ 25.0% - 25.5% ] 25.41% | 3,199 | 6.4% |
[ 25.5% - 26.0% ] 25.53% | 47 | 57.1% |
[ 26.0% - 26.5% ] 26.22% | 2,136 | 8.1% |
[ 27.0% - 27.5% ] 27.36% | 793 | 29.3% |
[ 27.5% - 28.0% ] 27.66% | 141 | 4.3% |
[ 28.5% - 29.0% ] 28.79% | 3,050 | 13.0% |
[ 29.0% - 29.5% ] 29.27% | 328 | 43.8% |
[ 29.5% - 30.0% ] 29.74% | 2,014 | 23.0% |
[ 30.5% - 31.0% ] 30.53% | 606 | 23.0% |
[ 31.0% - 31.5% ] 31.20% | 407 | 10.6% |
[ 31.5% - 32.0% ] 31.58% | 57 | 13.0% |
[ 32.0% - 32.5% ] 32.43% | 37 | 48.0% |
[ 34.0% - 34.5% ] 34.29% | 35 | 50.0% |
[ 34.5% - 35.0% ] 34.79% | 891 | 15.7% |
[ 37.0% - 37.5% ] 37.50% | 16 | 10.0% |
[ 37.5% - 38.0% ] 37.80% | 746 | 40.9% |
[ 41.0% - 41.5% ] 41.45% | 152 | 16.7% |
[ 44.0% - 44.5% ] 44.44% | 9 | 66.7% |
[ 47.5% - 48.0% ] 47.59% | 145 | 13.2% |
[ 49.0% - 49.5% ] 49.12% | 57 | 4.0% |
[ 53.5% - 54.0% ] 53.85% | 104 | 28.3% |
[ 58.0% - 58.5% ] 58.17% | 208 | 56.1% |