Immigrants from Canada 4 or more Vehicles in Household

COMPARE

Immigrants from Canada
Race
Ancestry
AfghanAfricanAlaska NativeAlaskan AthabascanAlbanianAleutAlsatianAmericanApacheArabArapahoArgentineanArmenianAssyrian/Chaldean/SyriacAustralianAustrianBahamianBangladeshiBarbadianBasqueBelgianBelizeanBermudanBhutaneseBlackfeetBolivianBrazilianBritishBritish West IndianBulgarianBurmeseCajunCambodianCanadianCape VerdeanCarpatho RusynCelticCentral AmericanCentral American IndianCherokeeCheyenneChickasawChileanChineseChippewaChoctawColombianColvilleComancheCosta RicanCreeCreekCroatianCrowCubanCypriotCzechCzechoslovakianDanishDelawareDominicanDutchDutch West IndianEastern EuropeanEcuadorianEgyptianEnglishEstonianEthiopianEuropeanFijianFilipinoFinnishFrenchFrench American IndianFrench CanadianGermanGerman RussianGhanaianGreekGuamanian/ChamorroGuatemalanGuyaneseHaitianHmongHonduranHopiHoumaHungarianIcelanderIndian (Asian)IndonesianInupiatIranianIraqiIrishIroquoisIsraeliItalianJamaicanJapaneseJordanianKenyanKiowaKoreanLaotianLatvianLebaneseLiberianLithuanianLumbeeLuxembourgerMacedonianMalaysianMalteseMarshalleseMenomineeMexicanMexican American IndianMongolianMoroccanNative HawaiianNavajoNepaleseNew ZealanderNicaraguanNigerianNorthern EuropeanNorwegianOkinawanOsageOttawaPaiutePakistaniPalestinianPanamanianParaguayanPennsylvania GermanPeruvianPimaPolishPortuguesePotawatomiPuebloPuerto RicanPuget Sound SalishRomanianRussianSalvadoranSamoanScandinavianScotch-IrishScottishSeminoleSenegaleseSerbianShoshoneSierra LeoneanSiouxSlavicSlovakSloveneSomaliSouth AfricanSouth AmericanSouth American IndianSoviet UnionSpaniardSpanishSpanish AmericanSpanish American IndianSri LankanSubsaharan AfricanSudaneseSwedishSwissSyrianTaiwaneseThaiTlingit-HaidaTohono O'OdhamTonganTrinidadian and TobagonianTsimshianTurkishU.S. Virgin IslanderUgandanUkrainianUruguayanUteVenezuelanVietnameseWelshWest IndianYakamaYaquiYugoslavianYumanYup'ikZimbabwean
Immigration
NonimmigrantsImmigrantsAfghanistanAfricaAlbaniaArgentinaArmeniaAsiaAustraliaAustriaBahamasBangladeshBarbadosBelarusBelgiumBelizeBoliviaBosnia and HerzegovinaBrazilBulgariaBurma/MyanmarCabo VerdeCambodiaCameroonCanadaCaribbeanCentral AmericaChileChinaColombiaCongoCosta RicaCroatiaCubaCzechoslovakiaDenmarkDominicaDominican RepublicEastern AfricaEastern AsiaEastern EuropeEcuadorEgyptEl SalvadorEnglandEritreaEthiopiaEuropeFijiFranceGermanyGhanaGreeceGrenadaGuatemalaGuyanaHaitiHondurasHong KongHungaryIndiaIndonesiaIranIraqIrelandIsraelItalyJamaicaJapanJordanKazakhstanKenyaKoreaKuwaitLaosLatin AmericaLatviaLebanonLiberiaLithuaniaMalaysiaMexicoMicronesiaMiddle AfricaMoldovaMoroccoNepalNetherlandsNicaraguaNigeriaNorth AmericaNorth MacedoniaNorthern AfricaNorthern EuropeNorwayOceaniaPakistanPanamaPeruPhilippinesPolandPortugalRomaniaRussiaSaudi ArabiaScotlandSenegalSerbiaSierra LeoneSingaporeSomaliaSouth AfricaSouth AmericaSouth Central AsiaSouth Eastern AsiaSouthern EuropeSpainSri LankaSt. Vincent and the GrenadinesSudanSwedenSwitzerlandSyriaTaiwanThailandTrinidad and TobagoTurkeyUgandaUkraineUruguayUzbekistanVenezuelaVietnamWest IndiesWestern AfricaWestern AsiaWestern EuropeYemenZaireZimbabweAzores
Select to Compare
Race
Ancestry
AfghanAfricanAlaska NativeAlaskan AthabascanAlbanianAleutAlsatianAmericanApacheArabArapahoArgentineanArmenianAssyrian/Chaldean/SyriacAustralianAustrianBahamianBangladeshiBarbadianBasqueBelgianBelizeanBermudanBhutaneseBlackfeetBolivianBrazilianBritishBritish West IndianBulgarianBurmeseCajunCambodianCanadianCape VerdeanCarpatho RusynCelticCentral AmericanCentral American IndianCherokeeCheyenneChickasawChileanChineseChippewaChoctawColombianColvilleComancheCosta RicanCreeCreekCroatianCrowCubanCypriotCzechCzechoslovakianDanishDelawareDominicanDutchDutch West IndianEastern EuropeanEcuadorianEgyptianEnglishEstonianEthiopianEuropeanFijianFilipinoFinnishFrenchFrench American IndianFrench CanadianGermanGerman RussianGhanaianGreekGuamanian/ChamorroGuatemalanGuyaneseHaitianHmongHonduranHopiHoumaHungarianIcelanderIndian (Asian)IndonesianInupiatIranianIraqiIrishIroquoisIsraeliItalianJamaicanJapaneseJordanianKenyanKiowaKoreanLaotianLatvianLebaneseLiberianLithuanianLumbeeLuxembourgerMacedonianMalaysianMalteseMarshalleseMenomineeMexicanMexican American IndianMongolianMoroccanNative HawaiianNavajoNepaleseNew ZealanderNicaraguanNigerianNorthern EuropeanNorwegianOkinawanOsageOttawaPaiutePakistaniPalestinianPanamanianParaguayanPennsylvania GermanPeruvianPimaPolishPortuguesePotawatomiPuebloPuerto RicanPuget Sound SalishRomanianRussianSalvadoranSamoanScandinavianScotch-IrishScottishSeminoleSenegaleseSerbianShoshoneSierra LeoneanSiouxSlavicSlovakSloveneSomaliSouth AfricanSouth AmericanSouth American IndianSoviet UnionSpaniardSpanishSpanish AmericanSpanish American IndianSri LankanSubsaharan AfricanSudaneseSwedishSwissSyrianTaiwaneseThaiTlingit-HaidaTohono O'OdhamTonganTrinidadian and TobagonianTsimshianTurkishU.S. Virgin IslanderUgandanUkrainianUruguayanUteVenezuelanVietnameseWelshWest IndianYakamaYaquiYugoslavianYumanYup'ikZimbabwean
Immigration
NonimmigrantsImmigrantsAfghanistanAfricaAlbaniaArgentinaArmeniaAsiaAustraliaAustriaBahamasBangladeshBarbadosBelarusBelgiumBelizeBoliviaBosnia and HerzegovinaBrazilBulgariaBurma/MyanmarCabo VerdeCambodiaCameroonCaribbeanCentral AmericaChileChinaColombiaCongoCosta RicaCroatiaCubaCzechoslovakiaDenmarkDominicaDominican RepublicEastern AfricaEastern AsiaEastern EuropeEcuadorEgyptEl SalvadorEnglandEritreaEthiopiaEuropeFijiFranceGermanyGhanaGreeceGrenadaGuatemalaGuyanaHaitiHondurasHong KongHungaryIndiaIndonesiaIranIraqIrelandIsraelItalyJamaicaJapanJordanKazakhstanKenyaKoreaKuwaitLaosLatin AmericaLatviaLebanonLiberiaLithuaniaMalaysiaMexicoMicronesiaMiddle AfricaMoldovaMoroccoNepalNetherlandsNicaraguaNigeriaNorth AmericaNorth MacedoniaNorthern AfricaNorthern EuropeNorwayOceaniaPakistanPanamaPeruPhilippinesPolandPortugalRomaniaRussiaSaudi ArabiaScotlandSenegalSerbiaSierra LeoneSingaporeSomaliaSouth AfricaSouth AmericaSouth Central AsiaSouth Eastern AsiaSouthern EuropeSpainSri LankaSt. Vincent and the GrenadinesSudanSwedenSwitzerlandSyriaTaiwanThailandTrinidad and TobagoTurkeyUgandaUkraineUruguayUzbekistanVenezuelaVietnamWest IndiesWestern AfricaWestern AsiaWestern EuropeYemenZaireZimbabweAzores
4 or more Vehicles in Household
Income
Poverty
Unemployment
Labor Participation
Family Structure
Vehicle Availability
Education Level
Disability

Immigrants from Canada 4 or more Vehicles in Household
Good

6.5%
4+ VEHICLES AVAILABLE
78.6/ 100
METRIC RATING
143rd/ 347
METRIC RANK

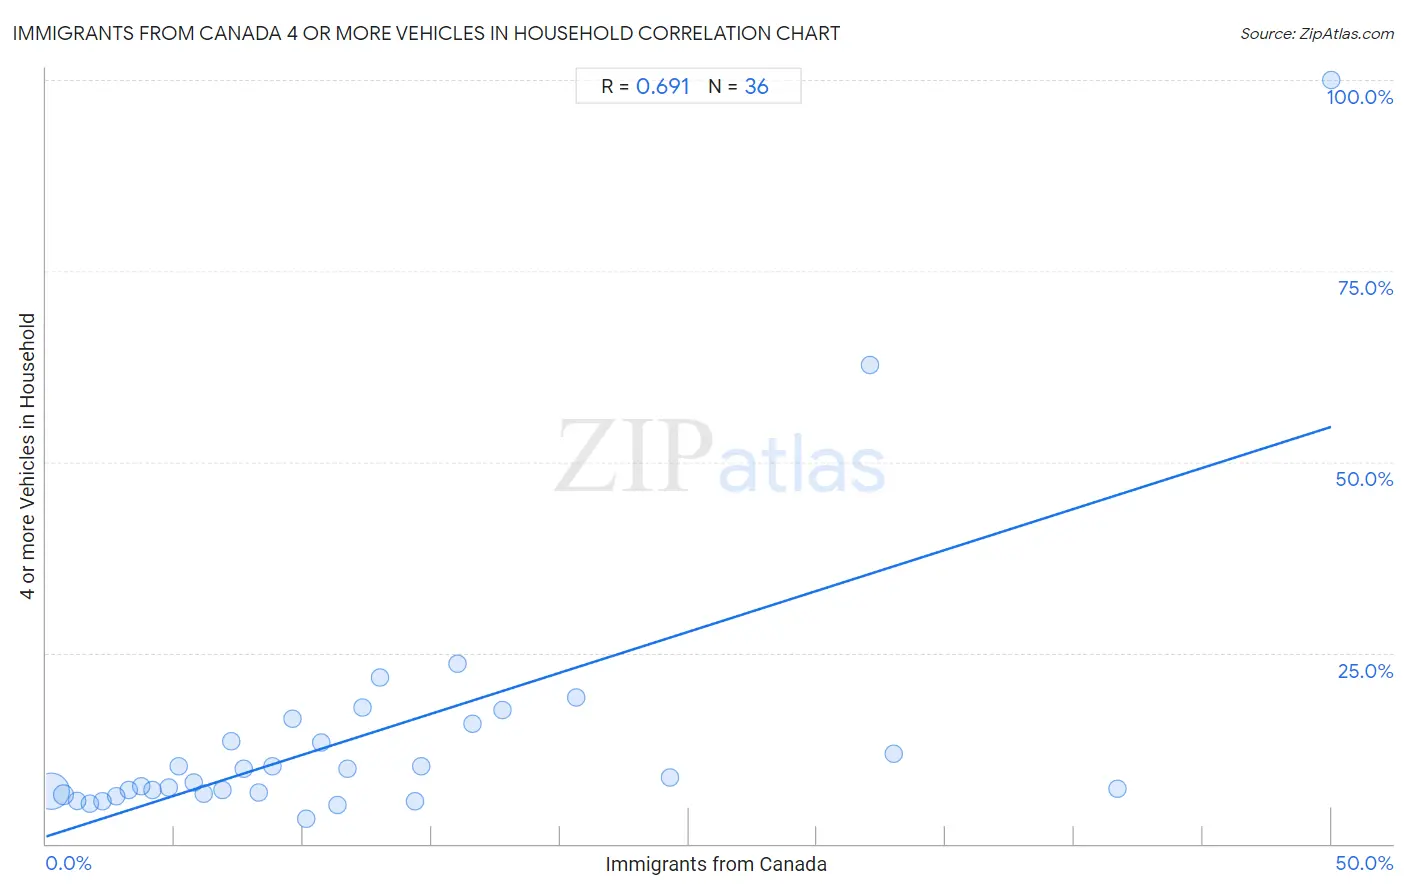
Immigrants from Canada 4 or more Vehicles in Household Correlation Chart

The statistical analysis conducted on geographies consisting of 457,196,725 people shows a significant positive correlation between the proportion of Immigrants from Canada and percentage of households with 4 or more vehicles available in the United States with a correlation coefficient (R) of 0.691 and weighted average of 6.5%. On average, for every 1% (one percent) increase in Immigrants from Canada within a typical geography, there is an increase of 1.1% in percentage of households with 4 or more vehicles available.
Immigrants from Canada 4 or more Vehicles in Household
It is essential to understand that the correlation between the percentage of Immigrants from Canada and percentage of households with 4 or more vehicles available does not imply a direct cause-and-effect relationship. It remains uncertain whether the presence of Immigrants from Canada influences an upward or downward trend in the level of percentage of households with 4 or more vehicles available within an area, or if Immigrants from Canada simply ended up residing in those areas with higher or lower levels of percentage of households with 4 or more vehicles available due to other factors.

Demographics Similar to Immigrants from Canada by 4 or more Vehicles in Household

In terms of 4 or more vehicles in household, the demographic groups most similar to Immigrants from Canada are Immigrants from North America (6.5%, a difference of 0.020%), Croatian (6.5%, a difference of 0.11%), Immigrants from Iraq (6.5%, a difference of 0.13%), Australian (6.6%, a difference of 0.33%), and Slavic (6.6%, a difference of 0.46%).
DemographicsRating | Rank4 or more Vehicles in Household
Luxembourgers
86.4
/100
|
#136
Excellent
6.6%
French Canadians
85.4
/100
|
#137
Excellent
6.6%
Italians
84.5
/100
|
#138
Excellent
6.6%
Jordanians
82.1
/100
|
#139
Excellent
6.6%
Slavs
81.6
/100
|
#140
Excellent
6.6%
Australians
80.8
/100
|
#141
Excellent
6.6%
Immigrants from Iraq
79.4
/100
|
#142
Good
6.5%
Immigrants from Canada
78.6
/100
|
#143
Good
6.5%
Immigrants from North America
78.5
/100
|
#144
Good
6.5%
Croatians
77.8
/100
|
#145
Good
6.5%
Immigrants from Costa Rica
74.4
/100
|
#146
Good
6.5%
Immigrants from Iran
73.9
/100
|
#147
Good
6.5%
Immigrants from Jordan
73.7
/100
|
#148
Good
6.5%
Greeks
73.6
/100
|
#149
Good
6.5%
New Zealanders
73.3
/100
|
#150
Good
6.5%

Immigrants from Canada 4 or more Vehicles in Household Correlation Summary

MeasurementImmigrants from Canada Data4 or more Vehicles in Household Data
Minimum0.19%3.3%
Maximum50.0%100.0%
Range49.8%96.7%
Mean12.2%14.1%
Median9.2%8.4%
Interquartile 25% (IQ1)4.4%6.7%
Interquartile 75% (IQ3)15.3%14.6%
Interquartile Range (IQR)10.9%7.9%
Standard Deviation (Sample)11.5%17.9%
Standard Deviation (Population)11.3%17.6%

Correlation Details

Immigrants from Canada PercentileSample Size4 or more Vehicles in Household
[
0.0%
-
0.5%
]
0.19%
376,526,8156.9%
[
0.5%
-
1.0%
]
0.68%
59,952,9936.4%
[
1.0%
-
1.5%
]
1.19%
13,379,7135.6%
[
1.5%
-
2.0%
]
1.69%
4,545,8045.2%
[
2.0%
-
2.5%
]
2.21%
1,464,5205.6%
[
2.5%
-
3.0%
]
2.72%
646,0796.2%
[
3.0%
-
3.5%
]
3.21%
196,9047.1%
[
3.5%
-
4.0%
]
3.70%
115,2357.6%
[
4.0%
-
4.5%
]
4.13%
155,1887.0%
[
4.5%
-
5.0%
]
4.75%
54,4977.4%
[
5.0%
-
5.5%
]
5.15%
38,61010.1%
[
5.5%
-
6.0%
]
5.75%
12,8958.1%
[
6.0%
-
6.5%
]
6.14%
32,8276.6%
[
6.5%
-
7.0%
]
6.88%
8,5347.1%
[
7.0%
-
7.5%
]
7.20%
23,42313.4%
[
7.5%
-
8.0%
]
7.67%
14,2869.8%
[
8.0%
-
8.5%
]
8.25%
2,0486.7%
[
8.5%
-
9.0%
]
8.82%
4,67110.1%
[
9.5%
-
10.0%
]
9.58%
1,29416.4%
[
10.0%
-
10.5%
]
10.11%
2,2453.3%
[
10.5%
-
11.0%
]
10.69%
2,41313.3%
[
11.0%
-
11.5%
]
11.32%
535.0%
[
11.5%
-
12.0%
]
11.70%
2,0859.9%
[
12.0%
-
12.5%
]
12.33%
43017.8%
[
12.5%
-
13.0%
]
12.99%
30821.8%
[
14.0%
-
14.5%
]
14.34%
1,2205.5%
[
14.5%
-
15.0%
]
14.62%
39010.2%
[
16.0%
-
16.5%
]
16.00%
10023.6%
[
16.5%
-
17.0%
]
16.59%
4,19615.8%
[
17.5%
-
18.0%
]
17.74%
3,90717.6%
[
20.5%
-
21.0%
]
20.62%
16019.1%
[
24.0%
-
24.5%
]
24.26%
2,4988.7%
[
32.0%
-
32.5%
]
32.05%
15662.7%
[
33.0%
-
33.5%
]
33.00%
20011.8%
[
41.5%
-
42.0%
]
41.67%
247.1%
[
50.0%
-
50.5%
]
50.00%
4100.0%