Immigrants from Eastern Asia 4 or more Vehicles in Household
COMPARE
Immigrants from Eastern Asia
Select to Compare
4 or more Vehicles in Household
Immigrants from Eastern Asia 4 or more Vehicles in Household
6.2%
4+ VEHICLES AVAILABLE
33.3/ 100
METRIC RATING
189th/ 347
METRIC RANK
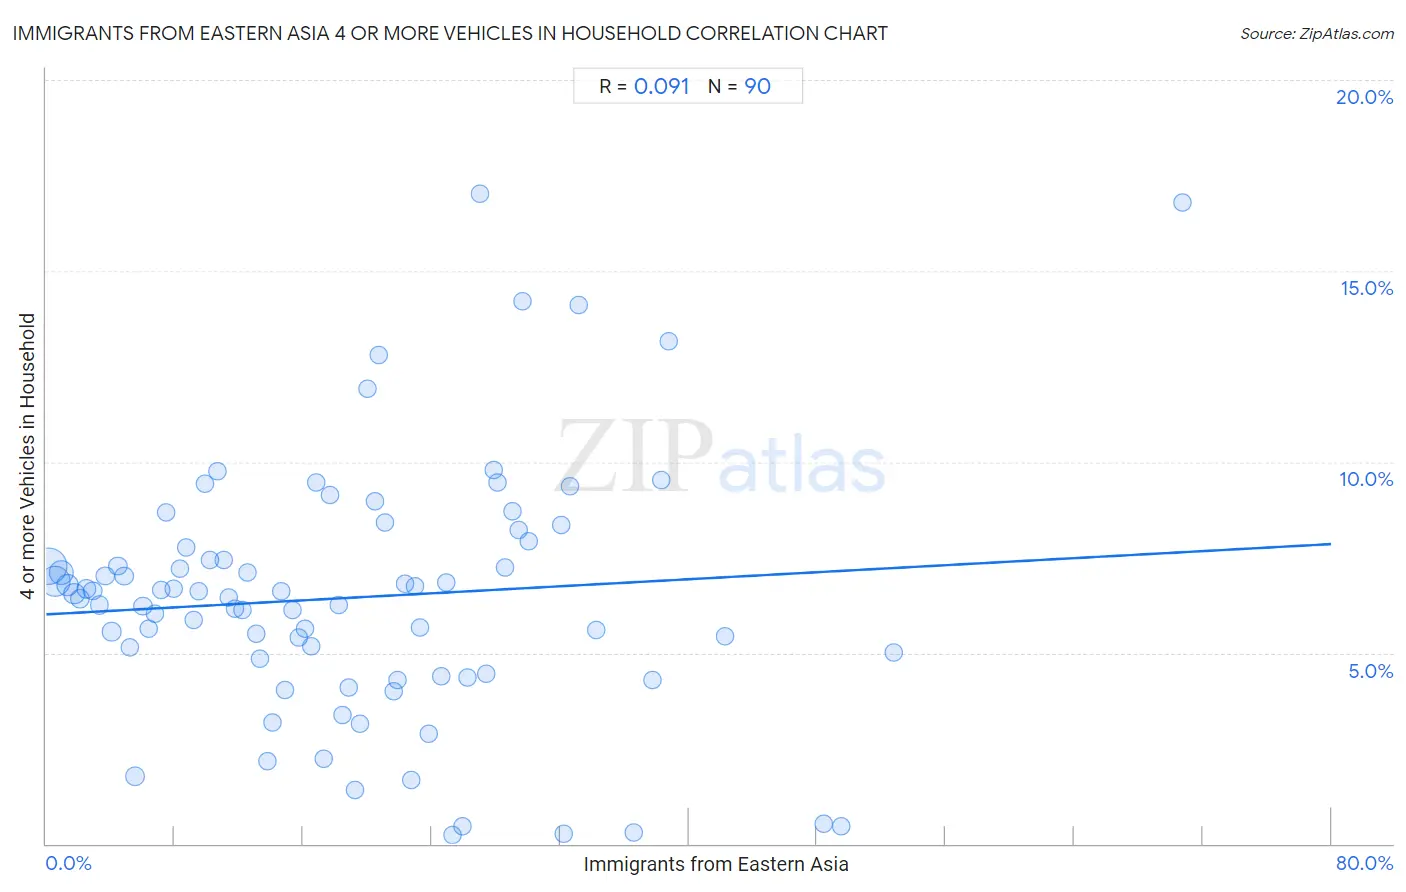
Immigrants from Eastern Asia 4 or more Vehicles in Household Correlation Chart
The statistical analysis conducted on geographies consisting of 497,144,085 people shows a slight positive correlation between the proportion of Immigrants from Eastern Asia and percentage of households with 4 or more vehicles available in the United States with a correlation coefficient (R) of 0.091 and weighted average of 6.2%. On average, for every 1% (one percent) increase in Immigrants from Eastern Asia within a typical geography, there is an increase of 0.023% in percentage of households with 4 or more vehicles available.
It is essential to understand that the correlation between the percentage of Immigrants from Eastern Asia and percentage of households with 4 or more vehicles available does not imply a direct cause-and-effect relationship. It remains uncertain whether the presence of Immigrants from Eastern Asia influences an upward or downward trend in the level of percentage of households with 4 or more vehicles available within an area, or if Immigrants from Eastern Asia simply ended up residing in those areas with higher or lower levels of percentage of households with 4 or more vehicles available due to other factors.
Demographics Similar to Immigrants from Eastern Asia by 4 or more Vehicles in Household
In terms of 4 or more vehicles in household, the demographic groups most similar to Immigrants from Eastern Asia are South African (6.2%, a difference of 0.12%), Kiowa (6.2%, a difference of 0.17%), Immigrants from South Africa (6.2%, a difference of 0.24%), Inupiat (6.2%, a difference of 0.30%), and Romanian (6.2%, a difference of 0.31%).
| Demographics | Rating | Rank | 4 or more Vehicles in Household |
| South American Indians | 40.7 /100 | #182 | Average 6.3% |
| Immigrants from Burma/Myanmar | 37.5 /100 | #183 | Fair 6.2% |
| Iraqis | 37.3 /100 | #184 | Fair 6.2% |
| Thais | 36.9 /100 | #185 | Fair 6.2% |
| Immigrants from Northern Europe | 36.8 /100 | #186 | Fair 6.2% |
| Immigrants from South Africa | 35.4 /100 | #187 | Fair 6.2% |
| Kiowa | 34.7 /100 | #188 | Fair 6.2% |
| Immigrants from Eastern Asia | 33.3 /100 | #189 | Fair 6.2% |
| South Africans | 32.2 /100 | #190 | Fair 6.2% |
| Inupiat | 30.7 /100 | #191 | Fair 6.2% |
| Romanians | 30.7 /100 | #192 | Fair 6.2% |
| Immigrants from Kuwait | 28.0 /100 | #193 | Fair 6.2% |
| Immigrants from Sweden | 27.0 /100 | #194 | Fair 6.2% |
| Argentineans | 27.0 /100 | #195 | Fair 6.2% |
| Tsimshian | 26.4 /100 | #196 | Fair 6.2% |
Immigrants from Eastern Asia 4 or more Vehicles in Household Correlation Summary
| Measurement | Immigrants from Eastern Asia Data | 4 or more Vehicles in Household Data |
| Minimum | 0.19% | 0.22% |
| Maximum | 70.7% | 17.0% |
| Range | 70.6% | 16.8% |
| Mean | 19.0% | 6.4% |
| Median | 17.5% | 6.5% |
| Interquartile 25% (IQ1) | 8.7% | 4.5% |
| Interquartile 75% (IQ3) | 27.0% | 7.8% |
| Interquartile Range (IQR) | 18.3% | 3.3% |
| Standard Deviation (Sample) | 13.2% | 3.3% |
| Standard Deviation (Population) | 13.2% | 3.3% |
Correlation Details
| Immigrants from Eastern Asia Percentile | Sample Size | 4 or more Vehicles in Household |
[ 0.0% - 0.5% ] 0.19% | 172,417,554 | 7.3% |
[ 0.5% - 1.0% ] 0.56% | 114,331,137 | 6.9% |
[ 0.5% - 1.0% ] 0.95% | 56,114,687 | 7.1% |
[ 1.0% - 1.5% ] 1.35% | 32,792,380 | 6.8% |
[ 1.5% - 2.0% ] 1.75% | 24,076,704 | 6.6% |
[ 2.0% - 2.5% ] 2.10% | 13,018,915 | 6.4% |
[ 2.0% - 2.5% ] 2.49% | 9,633,998 | 6.7% |
[ 2.5% - 3.0% ] 2.89% | 7,288,086 | 6.6% |
[ 3.0% - 3.5% ] 3.31% | 11,018,698 | 6.3% |
[ 3.5% - 4.0% ] 3.68% | 6,112,654 | 7.0% |
[ 4.0% - 4.5% ] 4.08% | 3,623,304 | 5.5% |
[ 4.0% - 4.5% ] 4.45% | 4,339,664 | 7.3% |
[ 4.5% - 5.0% ] 4.86% | 3,364,483 | 7.0% |
[ 5.0% - 5.5% ] 5.23% | 2,551,197 | 5.1% |
[ 5.5% - 6.0% ] 5.50% | 10,900,502 | 1.8% |
[ 6.0% - 6.5% ] 6.02% | 2,344,085 | 6.2% |
[ 6.0% - 6.5% ] 6.37% | 1,410,004 | 5.6% |
[ 6.5% - 7.0% ] 6.78% | 1,217,243 | 6.0% |
[ 7.0% - 7.5% ] 7.13% | 990,243 | 6.6% |
[ 7.0% - 7.5% ] 7.44% | 1,655,127 | 8.7% |
[ 7.5% - 8.0% ] 7.94% | 1,099,282 | 6.7% |
[ 8.0% - 8.5% ] 8.34% | 1,275,445 | 7.2% |
[ 8.5% - 9.0% ] 8.72% | 1,049,604 | 7.8% |
[ 9.0% - 9.5% ] 9.17% | 1,247,383 | 5.9% |
[ 9.5% - 10.0% ] 9.51% | 616,656 | 6.6% |
[ 9.5% - 10.0% ] 9.86% | 1,004,725 | 9.4% |
[ 10.0% - 10.5% ] 10.21% | 884,644 | 7.4% |
[ 10.5% - 11.0% ] 10.64% | 511,510 | 9.8% |
[ 11.0% - 11.5% ] 11.04% | 305,269 | 7.4% |
[ 11.0% - 11.5% ] 11.39% | 471,190 | 6.4% |
[ 11.5% - 12.0% ] 11.76% | 1,048,873 | 6.2% |
[ 12.0% - 12.5% ] 12.21% | 537,715 | 6.1% |
[ 12.5% - 13.0% ] 12.51% | 567,876 | 7.1% |
[ 13.0% - 13.5% ] 13.04% | 129,376 | 5.5% |
[ 13.0% - 13.5% ] 13.32% | 551,534 | 4.8% |
[ 13.5% - 14.0% ] 13.76% | 1,130,516 | 2.2% |
[ 14.0% - 14.5% ] 14.12% | 473,003 | 3.2% |
[ 14.5% - 15.0% ] 14.61% | 126,598 | 6.6% |
[ 14.5% - 15.0% ] 14.89% | 111,011 | 4.0% |
[ 15.0% - 15.5% ] 15.30% | 255,554 | 6.1% |
[ 15.5% - 16.0% ] 15.74% | 160,364 | 5.4% |
[ 16.0% - 16.5% ] 16.09% | 178,989 | 5.6% |
[ 16.0% - 16.5% ] 16.47% | 180,691 | 5.2% |
[ 16.5% - 17.0% ] 16.83% | 589,295 | 9.4% |
[ 17.0% - 17.5% ] 17.31% | 228,552 | 2.2% |
[ 17.5% - 18.0% ] 17.67% | 82,360 | 9.1% |
[ 18.0% - 18.5% ] 18.18% | 297 | 6.2% |
[ 18.0% - 18.5% ] 18.44% | 94,833 | 3.4% |
[ 18.5% - 19.0% ] 18.85% | 157,042 | 4.1% |
[ 19.0% - 19.5% ] 19.23% | 118,464 | 1.4% |
[ 19.5% - 20.0% ] 19.55% | 100,680 | 3.1% |
[ 19.5% - 20.0% ] 19.99% | 73,691 | 11.9% |
[ 20.0% - 20.5% ] 20.45% | 346,399 | 9.0% |
[ 20.5% - 21.0% ] 20.67% | 156,580 | 12.8% |
[ 21.0% - 21.5% ] 21.10% | 100,371 | 8.4% |
[ 21.5% - 22.0% ] 21.63% | 34,604 | 4.0% |
[ 21.5% - 22.0% ] 21.86% | 61,110 | 4.3% |
[ 22.0% - 22.5% ] 22.31% | 90,420 | 6.8% |
[ 22.5% - 23.0% ] 22.70% | 93,439 | 1.7% |
[ 22.5% - 23.0% ] 22.94% | 128,109 | 6.7% |
[ 23.0% - 23.5% ] 23.27% | 82,295 | 5.6% |
[ 23.5% - 24.0% ] 23.83% | 100,173 | 2.9% |
[ 24.5% - 25.0% ] 24.60% | 83,601 | 4.4% |
[ 24.5% - 25.0% ] 24.88% | 70,110 | 6.8% |
[ 25.0% - 25.5% ] 25.31% | 76,518 | 0.22% |
[ 25.5% - 26.0% ] 25.88% | 93,232 | 0.46% |
[ 26.0% - 26.5% ] 26.24% | 58,223 | 4.4% |
[ 27.0% - 27.5% ] 27.03% | 111 | 17.0% |
[ 27.0% - 27.5% ] 27.42% | 123,259 | 4.5% |
[ 27.5% - 28.0% ] 27.83% | 78,835 | 9.8% |
[ 28.0% - 28.5% ] 28.13% | 33,937 | 9.5% |
[ 28.5% - 29.0% ] 28.57% | 68,923 | 7.2% |
[ 29.0% - 29.5% ] 29.01% | 120,290 | 8.7% |
[ 29.0% - 29.5% ] 29.42% | 36,165 | 8.2% |
[ 29.5% - 30.0% ] 29.63% | 82,746 | 14.2% |
[ 30.0% - 30.5% ] 30.04% | 40,738 | 7.9% |
[ 32.0% - 32.5% ] 32.09% | 430 | 8.3% |
[ 32.0% - 32.5% ] 32.18% | 25,460 | 0.27% |
[ 32.5% - 33.0% ] 32.57% | 61,562 | 9.4% |
[ 33.0% - 33.5% ] 33.18% | 91,060 | 14.1% |
[ 34.0% - 34.5% ] 34.23% | 222 | 5.6% |
[ 36.5% - 37.0% ] 36.60% | 12,070 | 0.29% |
[ 37.5% - 38.0% ] 37.70% | 183 | 4.3% |
[ 38.0% - 38.5% ] 38.31% | 26,418 | 9.5% |
[ 38.5% - 39.0% ] 38.75% | 25,001 | 13.2% |
[ 42.0% - 42.5% ] 42.24% | 40,462 | 5.4% |
[ 48.0% - 48.5% ] 48.39% | 57,556 | 0.52% |
[ 49.0% - 49.5% ] 49.50% | 79,495 | 0.45% |
[ 52.5% - 53.0% ] 52.78% | 144 | 5.0% |
[ 70.5% - 71.0% ] 70.75% | 147 | 16.8% |