Central American 4 or more Vehicles in Household
COMPARE
Central American
Select to Compare
4 or more Vehicles in Household
Central American 4 or more Vehicles in Household
7.1%
4+ VEHICLES AVAILABLE
99.3/ 100
METRIC RATING
96th/ 347
METRIC RANK
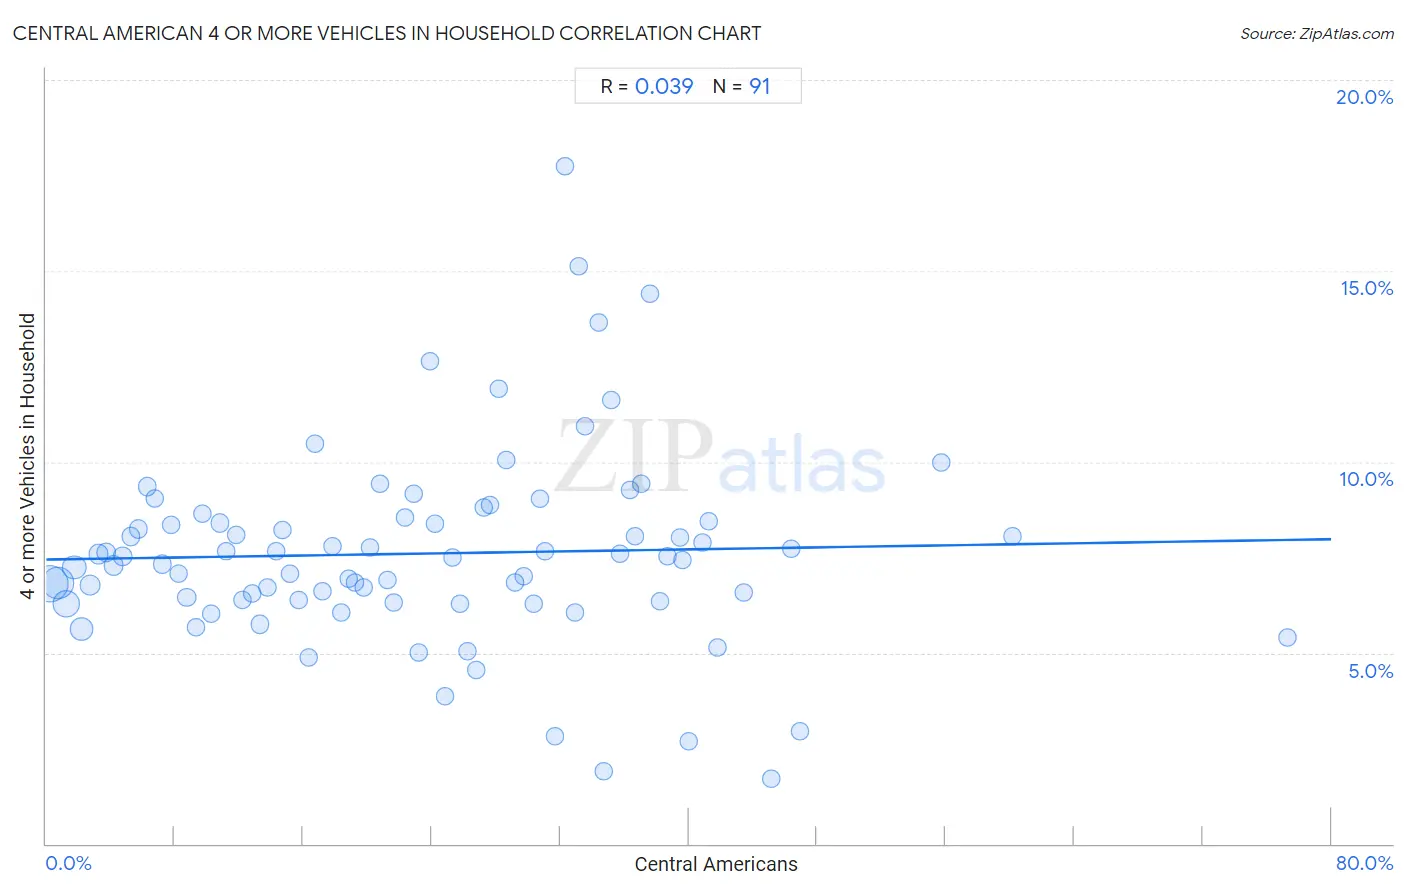
Central American 4 or more Vehicles in Household Correlation Chart
The statistical analysis conducted on geographies consisting of 501,959,765 people shows no correlation between the proportion of Central Americans and percentage of households with 4 or more vehicles available in the United States with a correlation coefficient (R) of 0.039 and weighted average of 7.1%. On average, for every 1% (one percent) increase in Central Americans within a typical geography, there is an increase of 0.0067% in percentage of households with 4 or more vehicles available.
It is essential to understand that the correlation between the percentage of Central Americans and percentage of households with 4 or more vehicles available does not imply a direct cause-and-effect relationship. It remains uncertain whether the presence of Central Americans influences an upward or downward trend in the level of percentage of households with 4 or more vehicles available within an area, or if Central Americans simply ended up residing in those areas with higher or lower levels of percentage of households with 4 or more vehicles available due to other factors.
Demographics Similar to Central Americans by 4 or more Vehicles in Household
In terms of 4 or more vehicles in household, the demographic groups most similar to Central Americans are Czechoslovakian (7.1%, a difference of 0.010%), Immigrants from Afghanistan (7.1%, a difference of 0.23%), Dutch West Indian (7.1%, a difference of 0.23%), Celtic (7.1%, a difference of 0.35%), and Immigrants from Latin America (7.1%, a difference of 0.41%).
| Demographics | Rating | Rank | 4 or more Vehicles in Household |
| British | 99.6 /100 | #89 | Exceptional 7.2% |
| Creek | 99.6 /100 | #90 | Exceptional 7.2% |
| Assyrians/Chaldeans/Syriacs | 99.4 /100 | #91 | Exceptional 7.2% |
| Immigrants from Latin America | 99.4 /100 | #92 | Exceptional 7.1% |
| Immigrants from Afghanistan | 99.3 /100 | #93 | Exceptional 7.1% |
| Dutch West Indians | 99.3 /100 | #94 | Exceptional 7.1% |
| Czechoslovakians | 99.3 /100 | #95 | Exceptional 7.1% |
| Central Americans | 99.3 /100 | #96 | Exceptional 7.1% |
| Celtics | 99.1 /100 | #97 | Exceptional 7.1% |
| Irish | 99.0 /100 | #98 | Exceptional 7.1% |
| Seminole | 98.8 /100 | #99 | Exceptional 7.0% |
| Taiwanese | 98.7 /100 | #100 | Exceptional 7.0% |
| Pakistanis | 98.7 /100 | #101 | Exceptional 7.0% |
| Asians | 98.6 /100 | #102 | Exceptional 7.0% |
| Blackfeet | 98.6 /100 | #103 | Exceptional 7.0% |
Central American 4 or more Vehicles in Household Correlation Summary
| Measurement | Central American Data | 4 or more Vehicles in Household Data |
| Minimum | 0.24% | 1.7% |
| Maximum | 77.3% | 17.7% |
| Range | 77.1% | 16.0% |
| Mean | 23.5% | 7.6% |
| Median | 22.9% | 7.5% |
| Interquartile 25% (IQ1) | 11.2% | 6.3% |
| Interquartile 75% (IQ3) | 34.4% | 8.4% |
| Interquartile Range (IQR) | 23.2% | 2.1% |
| Standard Deviation (Sample) | 14.9% | 2.6% |
| Standard Deviation (Population) | 14.8% | 2.6% |
Correlation Details
| Central American Percentile | Sample Size | 4 or more Vehicles in Household |
[ 0.0% - 0.5% ] 0.24% | 145,124,066 | 6.8% |
[ 0.5% - 1.0% ] 0.74% | 99,649,992 | 6.8% |
[ 1.0% - 1.5% ] 1.24% | 67,420,904 | 6.3% |
[ 1.5% - 2.0% ] 1.74% | 40,763,388 | 7.2% |
[ 2.0% - 2.5% ] 2.21% | 34,379,999 | 5.6% |
[ 2.5% - 3.0% ] 2.75% | 17,858,362 | 6.8% |
[ 3.0% - 3.5% ] 3.25% | 13,459,234 | 7.6% |
[ 3.5% - 4.0% ] 3.74% | 10,771,521 | 7.6% |
[ 4.0% - 4.5% ] 4.20% | 11,920,081 | 7.3% |
[ 4.5% - 5.0% ] 4.77% | 7,769,718 | 7.5% |
[ 5.0% - 5.5% ] 5.26% | 5,368,714 | 8.0% |
[ 5.5% - 6.0% ] 5.74% | 5,779,416 | 8.2% |
[ 6.0% - 6.5% ] 6.28% | 3,617,061 | 9.4% |
[ 6.5% - 7.0% ] 6.76% | 3,870,440 | 9.0% |
[ 7.0% - 7.5% ] 7.25% | 2,740,672 | 7.3% |
[ 7.5% - 8.0% ] 7.76% | 1,889,065 | 8.3% |
[ 8.0% - 8.5% ] 8.21% | 2,111,772 | 7.1% |
[ 8.5% - 9.0% ] 8.74% | 1,800,200 | 6.5% |
[ 9.0% - 9.5% ] 9.33% | 3,984,087 | 5.7% |
[ 9.5% - 10.0% ] 9.73% | 1,158,332 | 8.7% |
[ 10.0% - 10.5% ] 10.29% | 945,205 | 6.0% |
[ 10.5% - 11.0% ] 10.78% | 1,216,902 | 8.4% |
[ 11.0% - 11.5% ] 11.23% | 804,176 | 7.7% |
[ 11.5% - 12.0% ] 11.80% | 1,073,129 | 8.1% |
[ 12.0% - 12.5% ] 12.24% | 640,921 | 6.4% |
[ 12.5% - 13.0% ] 12.84% | 4,751,906 | 6.5% |
[ 13.0% - 13.5% ] 13.27% | 803,276 | 5.7% |
[ 13.5% - 14.0% ] 13.79% | 825,353 | 6.7% |
[ 14.0% - 14.5% ] 14.31% | 885,623 | 7.7% |
[ 14.5% - 15.0% ] 14.73% | 446,705 | 8.2% |
[ 15.0% - 15.5% ] 15.17% | 401,761 | 7.1% |
[ 15.5% - 16.0% ] 15.73% | 447,291 | 6.4% |
[ 16.0% - 16.5% ] 16.33% | 836,848 | 4.9% |
[ 16.5% - 17.0% ] 16.74% | 537,514 | 10.5% |
[ 17.0% - 17.5% ] 17.16% | 384,359 | 6.6% |
[ 17.5% - 18.0% ] 17.84% | 298,102 | 7.8% |
[ 18.0% - 18.5% ] 18.37% | 53,874 | 6.0% |
[ 18.5% - 19.0% ] 18.84% | 665,181 | 7.0% |
[ 19.0% - 19.5% ] 19.23% | 108,781 | 6.9% |
[ 19.5% - 20.0% ] 19.76% | 248,266 | 6.7% |
[ 20.0% - 20.5% ] 20.14% | 208,675 | 7.8% |
[ 20.5% - 21.0% ] 20.76% | 170,069 | 9.4% |
[ 21.0% - 21.5% ] 21.28% | 253,400 | 6.9% |
[ 21.5% - 22.0% ] 21.63% | 106,899 | 6.3% |
[ 22.0% - 22.5% ] 22.31% | 75,746 | 8.6% |
[ 22.5% - 23.0% ] 22.87% | 187,299 | 9.2% |
[ 23.0% - 23.5% ] 23.19% | 142,386 | 5.0% |
[ 23.5% - 24.0% ] 23.86% | 12,318 | 12.6% |
[ 24.0% - 24.5% ] 24.18% | 183,807 | 8.4% |
[ 24.5% - 25.0% ] 24.80% | 179,958 | 3.9% |
[ 25.0% - 25.5% ] 25.27% | 119,504 | 7.5% |
[ 25.5% - 26.0% ] 25.77% | 250,986 | 6.3% |
[ 26.0% - 26.5% ] 26.24% | 222,979 | 5.1% |
[ 26.5% - 27.0% ] 26.79% | 258,344 | 4.5% |
[ 27.0% - 27.5% ] 27.25% | 17,340 | 8.8% |
[ 27.5% - 28.0% ] 27.62% | 152,945 | 8.9% |
[ 28.0% - 28.5% ] 28.21% | 47,338 | 11.9% |
[ 28.5% - 29.0% ] 28.67% | 56,405 | 10.0% |
[ 29.0% - 29.5% ] 29.17% | 107,395 | 6.8% |
[ 29.5% - 30.0% ] 29.76% | 115,067 | 7.0% |
[ 30.0% - 30.5% ] 30.32% | 124,058 | 6.3% |
[ 30.5% - 31.0% ] 30.77% | 207,899 | 9.0% |
[ 31.0% - 31.5% ] 31.04% | 98,190 | 7.7% |
[ 31.5% - 32.0% ] 31.64% | 62,846 | 2.8% |
[ 32.0% - 32.5% ] 32.32% | 138,223 | 17.7% |
[ 32.5% - 33.0% ] 32.90% | 22,966 | 6.1% |
[ 33.0% - 33.5% ] 33.17% | 77,314 | 15.1% |
[ 33.5% - 34.0% ] 33.56% | 33,122 | 10.9% |
[ 34.0% - 34.5% ] 34.38% | 10,639 | 13.7% |
[ 34.5% - 35.0% ] 34.73% | 59,607 | 1.9% |
[ 35.0% - 35.5% ] 35.20% | 9,444 | 11.6% |
[ 35.5% - 36.0% ] 35.69% | 33,018 | 7.6% |
[ 36.0% - 36.5% ] 36.32% | 1,473 | 9.3% |
[ 36.5% - 37.0% ] 36.65% | 96,220 | 8.1% |
[ 37.0% - 37.5% ] 37.05% | 19,289 | 9.4% |
[ 37.5% - 38.0% ] 37.61% | 10,563 | 14.4% |
[ 38.0% - 38.5% ] 38.18% | 2,622 | 6.3% |
[ 38.5% - 39.0% ] 38.65% | 39,220 | 7.5% |
[ 39.0% - 39.5% ] 39.46% | 25,324 | 8.0% |
[ 39.5% - 40.0% ] 39.65% | 7,945 | 7.4% |
[ 40.0% - 40.5% ] 40.02% | 8,575 | 2.7% |
[ 40.5% - 41.0% ] 40.86% | 15,109 | 7.9% |
[ 41.0% - 41.5% ] 41.21% | 18,695 | 8.4% |
[ 41.5% - 42.0% ] 41.78% | 1,764 | 5.1% |
[ 43.0% - 43.5% ] 43.43% | 175 | 6.6% |
[ 45.0% - 45.5% ] 45.12% | 79,765 | 1.7% |
[ 46.0% - 46.5% ] 46.36% | 2,118 | 7.7% |
[ 46.5% - 47.0% ] 46.92% | 211 | 2.9% |
[ 55.5% - 56.0% ] 55.70% | 149 | 10.0% |
[ 60.0% - 60.5% ] 60.18% | 50,387 | 8.0% |
[ 77.0% - 77.5% ] 77.31% | 21,778 | 5.4% |