Soviet Union 4 or more Vehicles in Household

COMPARE

Soviet Union
Race
Ancestry
AfghanAfricanAlaska NativeAlaskan AthabascanAlbanianAleutAlsatianAmericanApacheArabArapahoArgentineanArmenianAssyrian/Chaldean/SyriacAustralianAustrianBahamianBangladeshiBarbadianBasqueBelgianBelizeanBermudanBhutaneseBlackfeetBolivianBrazilianBritishBritish West IndianBulgarianBurmeseCajunCambodianCanadianCape VerdeanCarpatho RusynCelticCentral AmericanCentral American IndianCherokeeCheyenneChickasawChileanChineseChippewaChoctawColombianColvilleComancheCosta RicanCreeCreekCroatianCrowCubanCypriotCzechCzechoslovakianDanishDelawareDominicanDutchDutch West IndianEastern EuropeanEcuadorianEgyptianEnglishEstonianEthiopianEuropeanFijianFilipinoFinnishFrenchFrench American IndianFrench CanadianGermanGerman RussianGhanaianGreekGuamanian/ChamorroGuatemalanGuyaneseHaitianHmongHonduranHopiHoumaHungarianIcelanderIndian (Asian)IndonesianInupiatIranianIraqiIrishIroquoisIsraeliItalianJamaicanJapaneseJordanianKenyanKiowaKoreanLaotianLatvianLebaneseLiberianLithuanianLumbeeLuxembourgerMacedonianMalaysianMalteseMarshalleseMenomineeMexicanMexican American IndianMongolianMoroccanNative HawaiianNavajoNepaleseNew ZealanderNicaraguanNigerianNorthern EuropeanNorwegianOkinawanOsageOttawaPaiutePakistaniPalestinianPanamanianParaguayanPennsylvania GermanPeruvianPimaPolishPortuguesePotawatomiPuebloPuerto RicanPuget Sound SalishRomanianRussianSalvadoranSamoanScandinavianScotch-IrishScottishSeminoleSenegaleseSerbianShoshoneSierra LeoneanSiouxSlavicSlovakSloveneSomaliSouth AfricanSouth AmericanSouth American IndianSoviet UnionSpaniardSpanishSpanish AmericanSpanish American IndianSri LankanSubsaharan AfricanSudaneseSwedishSwissSyrianTaiwaneseThaiTlingit-HaidaTohono O'OdhamTonganTrinidadian and TobagonianTsimshianTurkishU.S. Virgin IslanderUgandanUkrainianUruguayanUteVenezuelanVietnameseWelshWest IndianYakamaYaquiYugoslavianYumanYup'ikZimbabwean
Immigration
NonimmigrantsImmigrantsAfghanistanAfricaAlbaniaArgentinaArmeniaAsiaAustraliaAustriaBahamasBangladeshBarbadosBelarusBelgiumBelizeBoliviaBosnia and HerzegovinaBrazilBulgariaBurma/MyanmarCabo VerdeCambodiaCameroonCanadaCaribbeanCentral AmericaChileChinaColombiaCongoCosta RicaCroatiaCubaCzechoslovakiaDenmarkDominicaDominican RepublicEastern AfricaEastern AsiaEastern EuropeEcuadorEgyptEl SalvadorEnglandEritreaEthiopiaEuropeFijiFranceGermanyGhanaGreeceGrenadaGuatemalaGuyanaHaitiHondurasHong KongHungaryIndiaIndonesiaIranIraqIrelandIsraelItalyJamaicaJapanJordanKazakhstanKenyaKoreaKuwaitLaosLatin AmericaLatviaLebanonLiberiaLithuaniaMalaysiaMexicoMicronesiaMiddle AfricaMoldovaMoroccoNepalNetherlandsNicaraguaNigeriaNorth AmericaNorth MacedoniaNorthern AfricaNorthern EuropeNorwayOceaniaPakistanPanamaPeruPhilippinesPolandPortugalRomaniaRussiaSaudi ArabiaScotlandSenegalSerbiaSierra LeoneSingaporeSomaliaSouth AfricaSouth AmericaSouth Central AsiaSouth Eastern AsiaSouthern EuropeSpainSri LankaSt. Vincent and the GrenadinesSudanSwedenSwitzerlandSyriaTaiwanThailandTrinidad and TobagoTurkeyUgandaUkraineUruguayUzbekistanVenezuelaVietnamWest IndiesWestern AfricaWestern AsiaWestern EuropeYemenZaireZimbabweAzores
Select to Compare
Race
Ancestry
AfghanAfricanAlaska NativeAlaskan AthabascanAlbanianAleutAlsatianAmericanApacheArabArapahoArgentineanArmenianAssyrian/Chaldean/SyriacAustralianAustrianBahamianBangladeshiBarbadianBasqueBelgianBelizeanBermudanBhutaneseBlackfeetBolivianBrazilianBritishBritish West IndianBulgarianBurmeseCajunCambodianCanadianCape VerdeanCarpatho RusynCelticCentral AmericanCentral American IndianCherokeeCheyenneChickasawChileanChineseChippewaChoctawColombianColvilleComancheCosta RicanCreeCreekCroatianCrowCubanCypriotCzechCzechoslovakianDanishDelawareDominicanDutchDutch West IndianEastern EuropeanEcuadorianEgyptianEnglishEstonianEthiopianEuropeanFijianFilipinoFinnishFrenchFrench American IndianFrench CanadianGermanGerman RussianGhanaianGreekGuamanian/ChamorroGuatemalanGuyaneseHaitianHmongHonduranHopiHoumaHungarianIcelanderIndian (Asian)IndonesianInupiatIranianIraqiIrishIroquoisIsraeliItalianJamaicanJapaneseJordanianKenyanKiowaKoreanLaotianLatvianLebaneseLiberianLithuanianLumbeeLuxembourgerMacedonianMalaysianMalteseMarshalleseMenomineeMexicanMexican American IndianMongolianMoroccanNative HawaiianNavajoNepaleseNew ZealanderNicaraguanNigerianNorthern EuropeanNorwegianOkinawanOsageOttawaPaiutePakistaniPalestinianPanamanianParaguayanPennsylvania GermanPeruvianPimaPolishPortuguesePotawatomiPuebloPuerto RicanPuget Sound SalishRomanianRussianSalvadoranSamoanScandinavianScotch-IrishScottishSeminoleSenegaleseSerbianShoshoneSierra LeoneanSiouxSlavicSlovakSloveneSomaliSouth AfricanSouth AmericanSouth American IndianSpaniardSpanishSpanish AmericanSpanish American IndianSri LankanSubsaharan AfricanSudaneseSwedishSwissSyrianTaiwaneseThaiTlingit-HaidaTohono O'OdhamTonganTrinidadian and TobagonianTsimshianTurkishU.S. Virgin IslanderUgandanUkrainianUruguayanUteVenezuelanVietnameseWelshWest IndianYakamaYaquiYugoslavianYumanYup'ikZimbabwean
Immigration
NonimmigrantsImmigrantsAfghanistanAfricaAlbaniaArgentinaArmeniaAsiaAustraliaAustriaBahamasBangladeshBarbadosBelarusBelgiumBelizeBoliviaBosnia and HerzegovinaBrazilBulgariaBurma/MyanmarCabo VerdeCambodiaCameroonCanadaCaribbeanCentral AmericaChileChinaColombiaCongoCosta RicaCroatiaCubaCzechoslovakiaDenmarkDominicaDominican RepublicEastern AfricaEastern AsiaEastern EuropeEcuadorEgyptEl SalvadorEnglandEritreaEthiopiaEuropeFijiFranceGermanyGhanaGreeceGrenadaGuatemalaGuyanaHaitiHondurasHong KongHungaryIndiaIndonesiaIranIraqIrelandIsraelItalyJamaicaJapanJordanKazakhstanKenyaKoreaKuwaitLaosLatin AmericaLatviaLebanonLiberiaLithuaniaMalaysiaMexicoMicronesiaMiddle AfricaMoldovaMoroccoNepalNetherlandsNicaraguaNigeriaNorth AmericaNorth MacedoniaNorthern AfricaNorthern EuropeNorwayOceaniaPakistanPanamaPeruPhilippinesPolandPortugalRomaniaRussiaSaudi ArabiaScotlandSenegalSerbiaSierra LeoneSingaporeSomaliaSouth AfricaSouth AmericaSouth Central AsiaSouth Eastern AsiaSouthern EuropeSpainSri LankaSt. Vincent and the GrenadinesSudanSwedenSwitzerlandSyriaTaiwanThailandTrinidad and TobagoTurkeyUgandaUkraineUruguayUzbekistanVenezuelaVietnamWest IndiesWestern AfricaWestern AsiaWestern EuropeYemenZaireZimbabweAzores
4 or more Vehicles in Household
Income
Poverty
Unemployment
Labor Participation
Family Structure
Vehicle Availability
Education Level
Disability

Soviet Union 4 or more Vehicles in Household
Tragic

4.4%
4+ VEHICLES AVAILABLE
0.0/ 100
METRIC RATING
324th/ 347
METRIC RANK

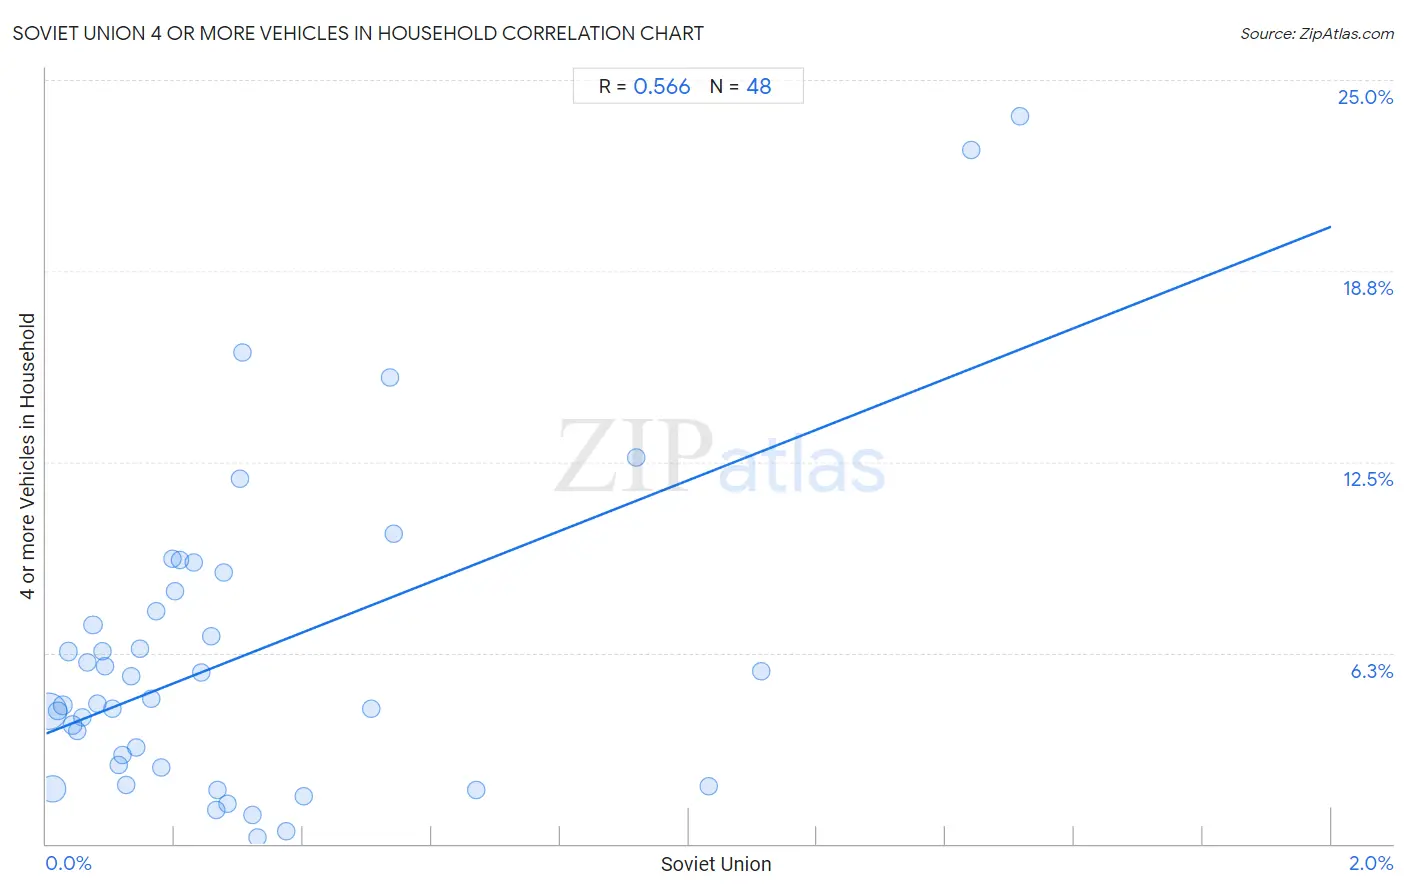
Soviet Union 4 or more Vehicles in Household Correlation Chart

The statistical analysis conducted on geographies consisting of 43,372,100 people shows a substantial positive correlation between the proportion of Soviet Union and percentage of households with 4 or more vehicles available in the United States with a correlation coefficient (R) of 0.566 and weighted average of 4.4%. On average, for every 1% (one percent) increase in Soviet Union within a typical geography, there is an increase of 8.3% in percentage of households with 4 or more vehicles available.
Soviet Union 4 or more Vehicles in Household
It is essential to understand that the correlation between the percentage of Soviet Union and percentage of households with 4 or more vehicles available does not imply a direct cause-and-effect relationship. It remains uncertain whether the presence of Soviet Union influences an upward or downward trend in the level of percentage of households with 4 or more vehicles available within an area, or if Soviet Union simply ended up residing in those areas with higher or lower levels of percentage of households with 4 or more vehicles available due to other factors.

Demographics Similar to Soviet Union by 4 or more Vehicles in Household

In terms of 4 or more vehicles in household, the demographic groups most similar to Soviet Union are Immigrants from Caribbean (4.4%, a difference of 0.28%), Immigrants from Jamaica (4.4%, a difference of 0.32%), Cape Verdean (4.4%, a difference of 0.64%), Immigrants from Yemen (4.5%, a difference of 0.69%), and Ecuadorian (4.5%, a difference of 0.86%).
DemographicsRating | Rank4 or more Vehicles in Household
U.S. Virgin Islanders
0.0
/100
|
#317
Tragic
4.6%
Jamaicans
0.0
/100
|
#318
Tragic
4.6%
Haitians
0.0
/100
|
#319
Tragic
4.6%
Immigrants from Haiti
0.0
/100
|
#320
Tragic
4.5%
Ecuadorians
0.0
/100
|
#321
Tragic
4.5%
Immigrants from Yemen
0.0
/100
|
#322
Tragic
4.5%
Immigrants from Caribbean
0.0
/100
|
#323
Tragic
4.4%
Soviet Union
0.0
/100
|
#324
Tragic
4.4%
Immigrants from Jamaica
0.0
/100
|
#325
Tragic
4.4%
Cape Verdeans
0.0
/100
|
#326
Tragic
4.4%
Senegalese
0.0
/100
|
#327
Tragic
4.3%
Trinidadians and Tobagonians
0.0
/100
|
#328
Tragic
4.3%
Immigrants from Senegal
0.0
/100
|
#329
Tragic
4.2%
Immigrants from Ecuador
0.0
/100
|
#330
Tragic
4.2%
West Indians
0.0
/100
|
#331
Tragic
4.2%

Soviet Union 4 or more Vehicles in Household Correlation Summary

MeasurementSoviet Union Data4 or more Vehicles in Household Data
Minimum0.0032%0.22%
Maximum1.5%23.8%
Range1.5%23.6%
Mean0.31%6.2%
Median0.20%4.7%
Interquartile 25% (IQ1)0.090%2.6%
Interquartile 75% (IQ3)0.33%7.9%
Interquartile Range (IQR)0.24%5.4%
Standard Deviation (Sample)0.35%5.1%
Standard Deviation (Population)0.35%5.1%

Correlation Details

Soviet Union PercentileSample Size4 or more Vehicles in Household
[
0.0%
-
0.5%
]
0.0032%
24,703,9134.3%
[
0.0%
-
0.5%
]
0.0095%
11,258,3231.8%
[
0.0%
-
0.5%
]
0.018%
1,009,1504.3%
[
0.0%
-
0.5%
]
0.026%
821,0994.5%
[
0.0%
-
0.5%
]
0.034%
932,9426.3%
[
0.0%
-
0.5%
]
0.040%
1,513,9243.9%
[
0.0%
-
0.5%
]
0.049%
675,3773.7%
[
0.0%
-
0.5%
]
0.056%
355,8174.1%
[
0.0%
-
0.5%
]
0.064%
277,0855.9%
[
0.0%
-
0.5%
]
0.073%
255,7337.2%
[
0.0%
-
0.5%
]
0.080%
327,9454.6%
[
0.0%
-
0.5%
]
0.088%
27,2116.3%
[
0.0%
-
0.5%
]
0.092%
34,9505.8%
[
0.0%
-
0.5%
]
0.10%
151,0944.4%
[
0.0%
-
0.5%
]
0.11%
95,6132.6%
[
0.0%
-
0.5%
]
0.12%
60,9882.9%
[
0.0%
-
0.5%
]
0.12%
104,9951.9%
[
0.0%
-
0.5%
]
0.13%
112,9055.5%
[
0.0%
-
0.5%
]
0.14%
34,0483.1%
[
0.0%
-
0.5%
]
0.15%
71,9096.4%
[
0.0%
-
0.5%
]
0.16%
2,4534.7%
[
0.0%
-
0.5%
]
0.17%
123,3377.6%
[
0.0%
-
0.5%
]
0.18%
6,1272.5%
[
0.0%
-
0.5%
]
0.20%
32,5379.3%
[
0.0%
-
0.5%
]
0.20%
7,9798.3%
[
0.0%
-
0.5%
]
0.21%
22,6309.3%
[
0.0%
-
0.5%
]
0.23%
23,4459.2%
[
0.0%
-
0.5%
]
0.24%
9,1565.6%
[
0.0%
-
0.5%
]
0.26%
6,6256.8%
[
0.0%
-
0.5%
]
0.26%
2,6531.1%
[
0.0%
-
0.5%
]
0.27%
60,2311.7%
[
0.0%
-
0.5%
]
0.28%
6,5178.9%
[
0.0%
-
0.5%
]
0.28%
10,3021.3%
[
0.0%
-
0.5%
]
0.30%
8,94311.9%
[
0.0%
-
0.5%
]
0.31%
27,17116.1%
[
0.0%
-
0.5%
]
0.32%
81,1090.92%
[
0.0%
-
0.5%
]
0.33%
20,4110.22%
[
0.0%
-
0.5%
]
0.37%
5,8970.39%
[
0.0%
-
0.5%
]
0.40%
1,0001.6%
[
0.5%
-
1.0%
]
0.51%
8,2984.4%
[
0.5%
-
1.0%
]
0.54%
15,49715.3%
[
0.5%
-
1.0%
]
0.54%
27,51410.1%
[
0.5%
-
1.0%
]
0.67%
26,5651.8%
[
0.5%
-
1.0%
]
0.92%
2,06712.6%
[
1.0%
-
1.5%
]
1.03%
7,0861.9%
[
1.0%
-
1.5%
]
1.11%
1,2585.7%
[
1.0%
-
1.5%
]
1.44%
13922.7%
[
1.5%
-
2.0%
]
1.52%
13223.8%